



Key Highlights
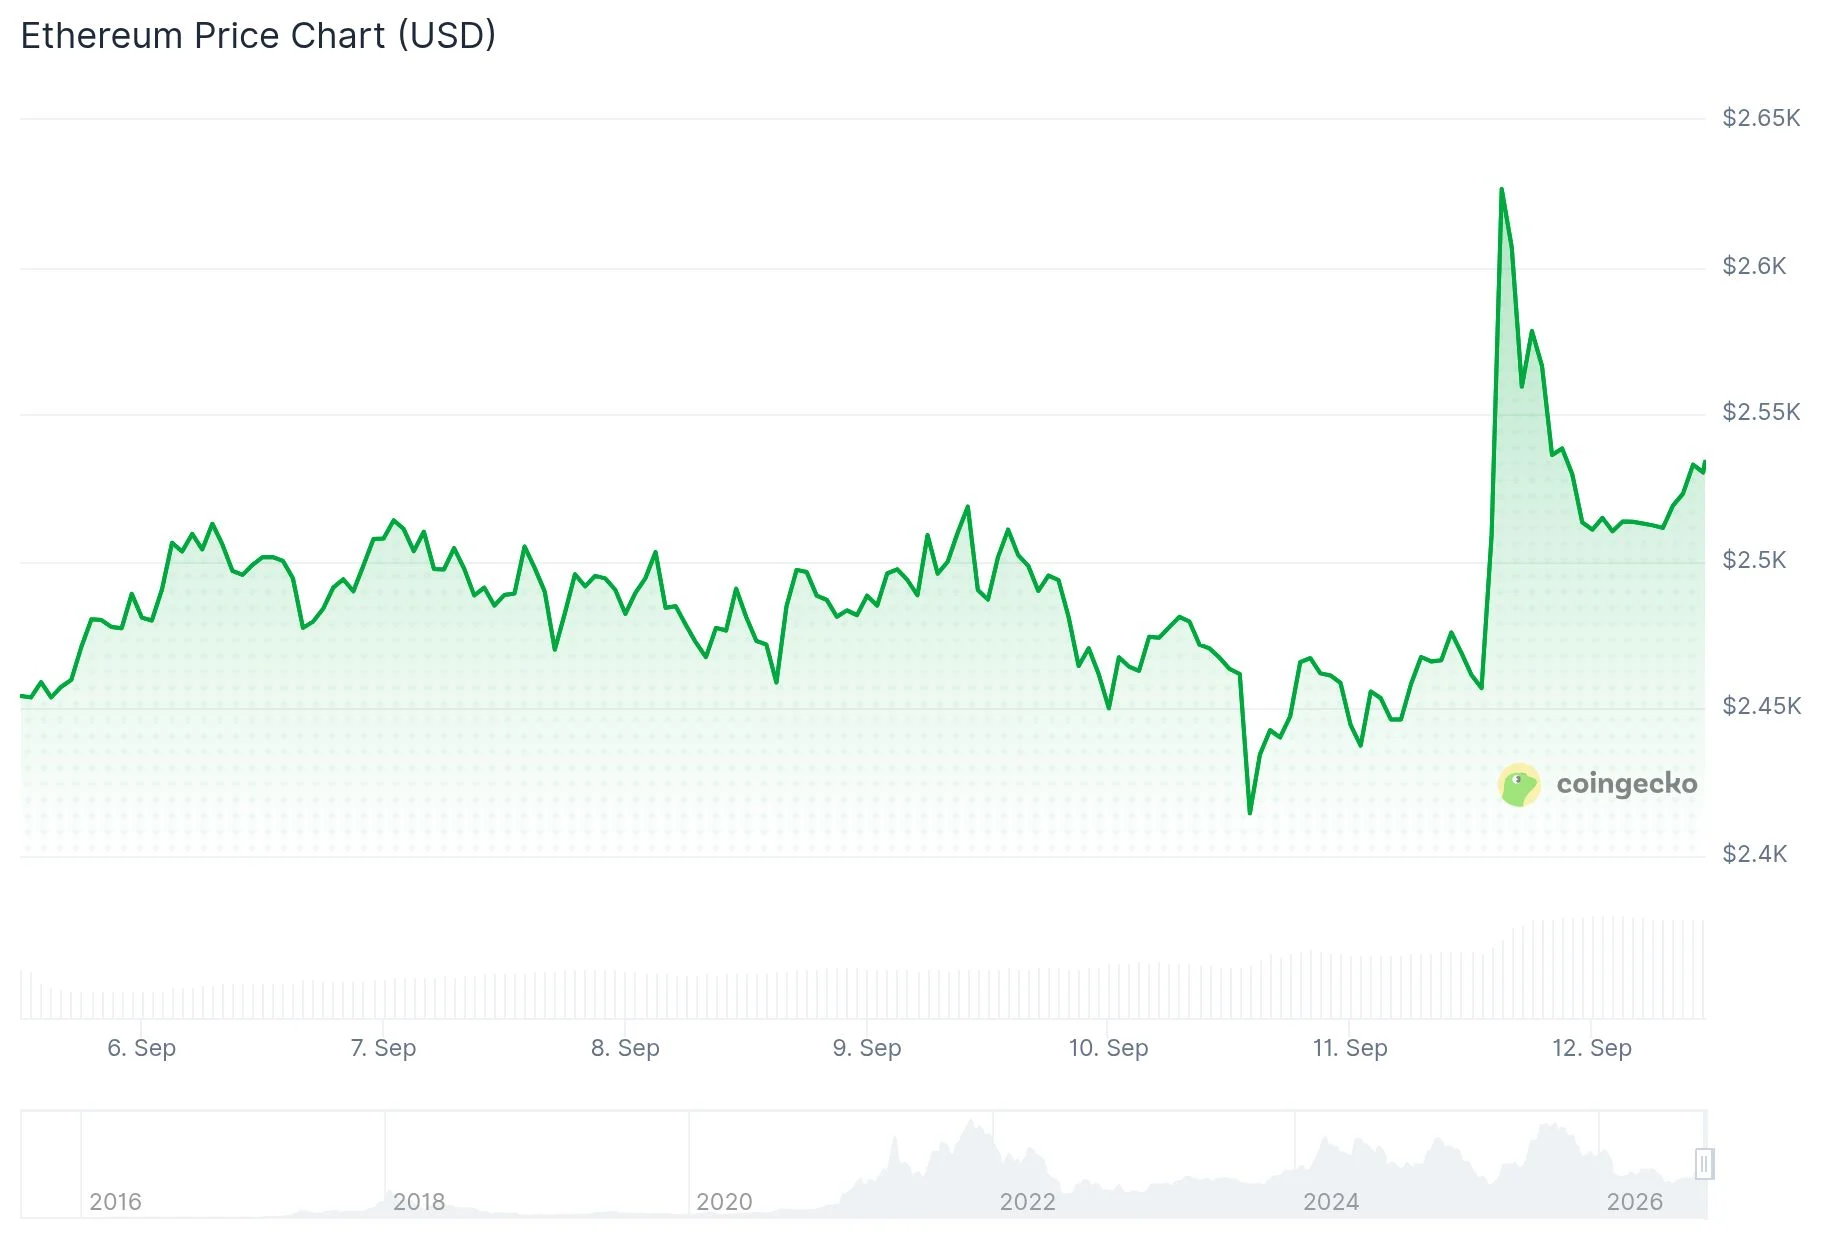
- Ethereum temporarily climbed past $2,600, marking its strongest performance since January
- Short positions worth $216 million were liquidated within a 24-hour period
- ETF products tracking Ethereum recorded $216.41 million in net inflows on September 11, the strongest showing in two weeks
- Goldman Sachs revised its forecast to anticipate a 25 basis point interest rate increase at the upcoming September 16 Federal Reserve meeting
- Technical analysts suggest ETH could climb to $2,800–$3,400 if current support levels remain intact
On September 11, Ethereum climbed beyond the $2,600 threshold, momentarily reaching $2,665 before settling back to approximately $2,510. This upward movement followed the publication of US Consumer Price Index figures, which revealed monthly inflation at 0.4% and annual inflation at 3.4%, matching market forecasts.
The core inflation metric, excluding volatile food and energy components, registered 0.3% on a monthly basis — surpassing the anticipated 0.2%. This stronger-than-expected reading prompted Goldman Sachs to adjust its outlook, with the financial institution now projecting a 25 basis point interest rate increase when the Federal Open Market Committee convenes on September 16. According to CoinGape’s prediction markets, there’s a 79% likelihood of such a rate adjustment.
Remarkably, Ethereum not only maintained its position amid this macroeconomic uncertainty but actually gained ground. This upward trajectory caught numerous bearish traders unprepared.
Cryptocurrency market observer Ash Crypto shared analysis on X indicating that ETH had successfully escaped from a 21-day bullish ascending triangle pattern, noting: “If this level holds, we can see $2,800–$3,400 next.” This technical breakout intensified the optimistic mood among market participants throughout the trading session.
Data from Coinglass reveals that the price spike resulted in approximately $216 million worth of short position liquidations across a 24-hour window. The most substantial individual liquidation reached nearly $20.3 million and occurred on the Hyperliquid platform. Meanwhile, ETH open interest declined to 12.5 million ETH, representing a decrease of 1.5 million tokens for that day.

Ethereum ETFs See Strongest Inflow Day in Two Weeks
Spot Ethereum exchange-traded funds recorded net inflows of $216.41 million on September 11 — representing the most robust capital influx since August 27. The BlackRock Ethereum Trust (ETHA) dominated with $148 million in new investments. The Bitcoin Ethereum ETF secured second position with $29 million in additions.
Combined trading volume across all Ethereum ETF products exceeded $2.56 billion, approaching Bitcoin’s $2.6 billion volume for the same period. Ethereum stood alone among major cryptocurrency funds in recording positive flows, while Bitcoin and Solana experienced capital withdrawals.
Jonathan Shugar, an analyst at Goldman Sachs, indicated that risk-oriented assets might continue appreciating even following a rate increase, potentially explaining the sustained institutional appetite for Ethereum exposure.
Large Holder Movements and Critical Price Zones
Market analyst Ali Martinez highlighted on X that approximately 10 million ETH had changed hands within the $2,700–$2,800 price band, characterizing this as a significant resistance barrier. According to Martinez, substantial holders would need to drive prices above this zone for Ethereum to advance toward $3,000. He additionally observed that Ethereum transactions exceeding $1 million in value increased by 14% on September 11, indicating heightened whale participation.
Market commentator Ted Pillows forecasted that a weekly candlestick closure above $2,550 could propel ETH toward the $3,000 milestone.
From a technical perspective, ETH continues trading above its 20-day, 50-day, 100-day, and 200-day exponential moving averages. The Relative Strength Index hovers around 63–64, reinforcing a constructive technical picture. Primary resistance zones are positioned at $2,626 and $2,786. Support foundations exist at $2,431, with additional cushions located near $2,235 and $2,182.
A daily closing price exceeding $2,516 could establish a trajectory toward the $2,700–$2,800 resistance cluster, while the 161.8% Fibonacci extension target rests at $3,100.
Get 3 Free Stock Ebooks
Discover top-performing stocks in AI, Crypto, and Technology with expert analysis.
- Top 10 AI Stocks - Leading AI companies
- Top 10 Crypto Stocks - Blockchain leaders
- Top 10 Tech Stocks - Tech giants


