



Key Takeaways
- Ethereum currently trades near $2,420 following a 3.60% decline over the past day
- Institutional demand remains robust with $234.51 million in spot ETF inflows recorded on August 27
- A major market participant acquired 5,425 ETH worth $13.55 million at approximately $2,498 per token
- Chain analytics indicate heightened profit realization activity, evidenced by SOPR metrics above 1.0
- Critical technical zones include support at $2,431 with overhead barriers at $2,680 and $2,879
Ethereum has settled around $2,420.48 following a moderate retracement of 3.60% over the most recent trading period. This correction arrives after a substantial August advance carried ETH beyond the $2,400 threshold for the first time in several months.
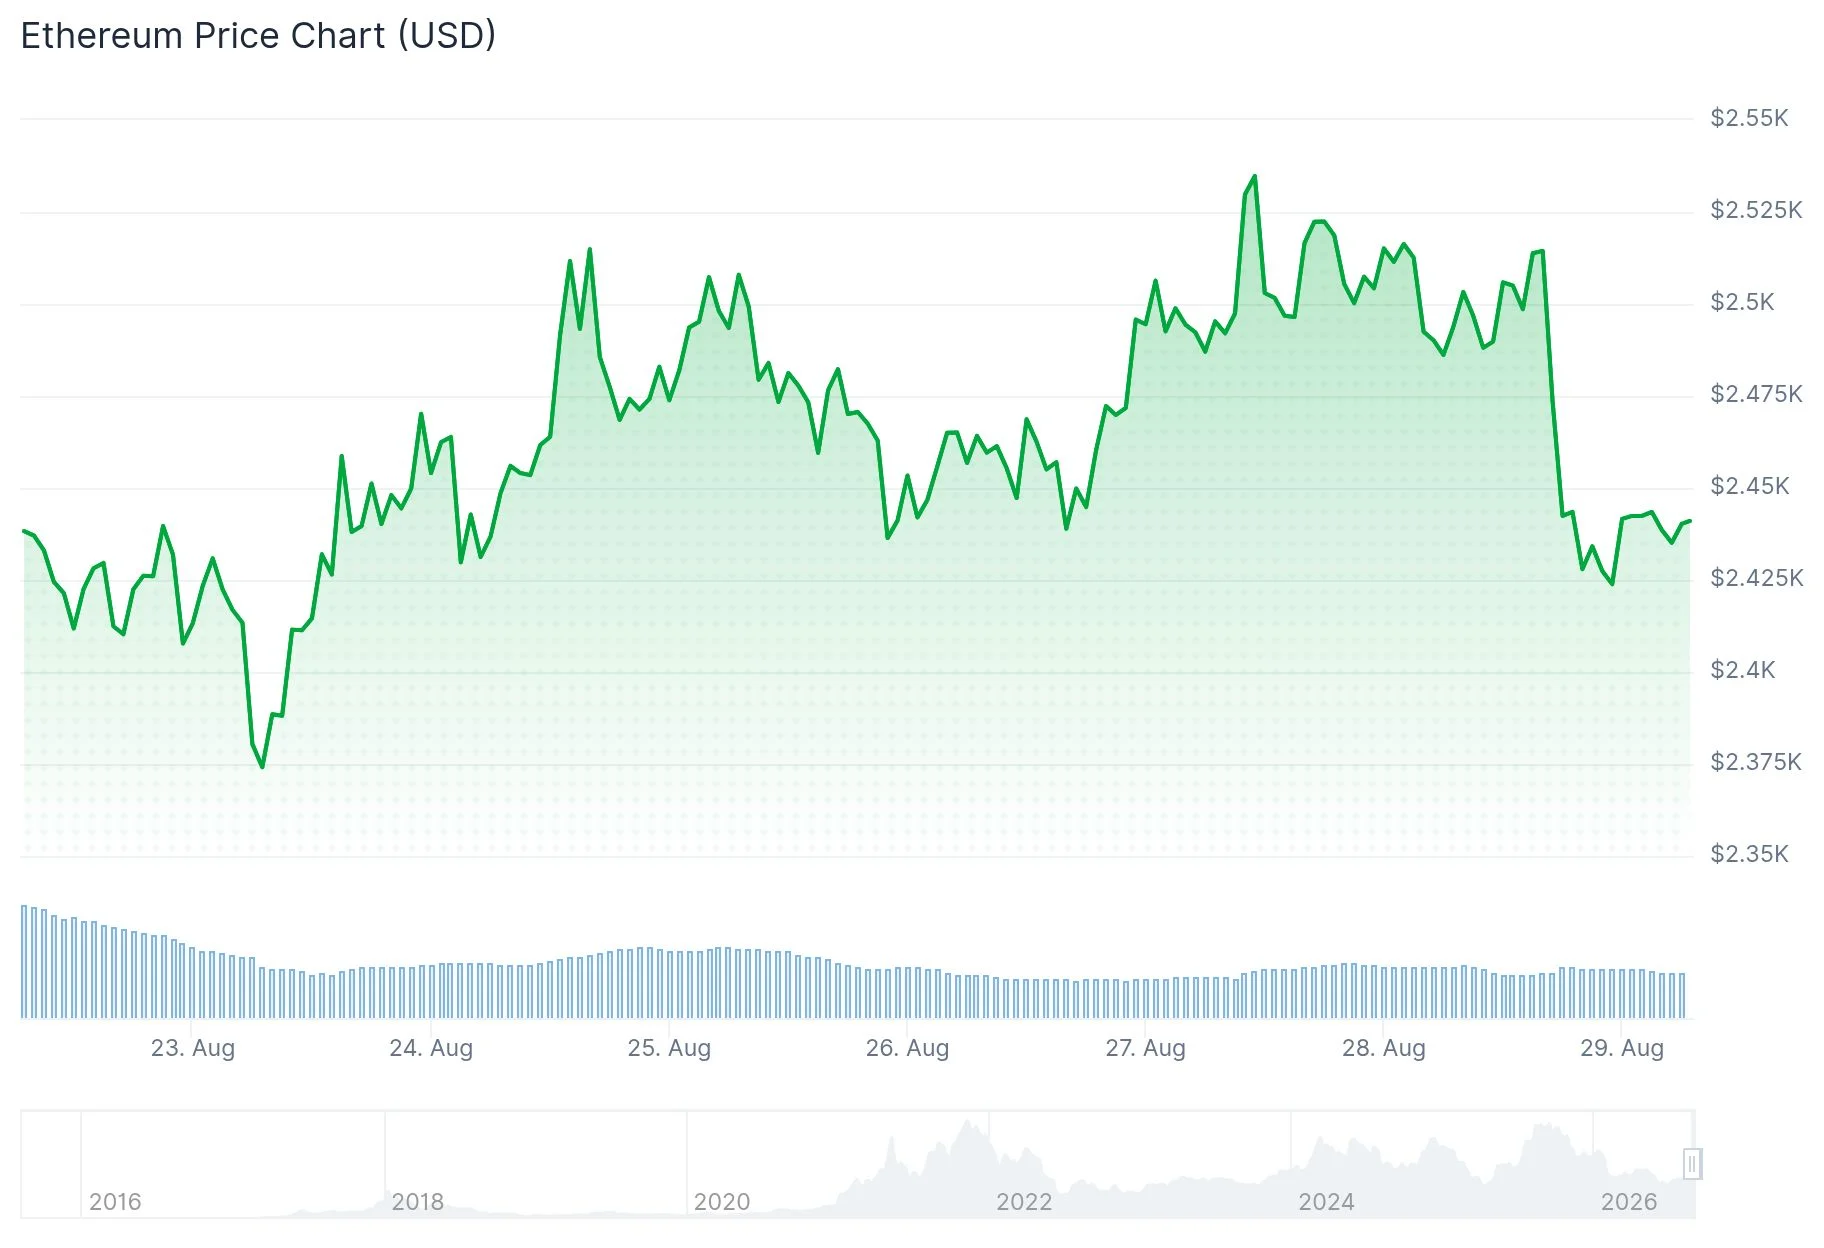
The recent downward pressure reflects what appears to be systematic profit extraction by market participants. ETH has advanced past its network-wide average acquisition cost of $2,306, a threshold that historically triggers selling pressure from holders who previously held unrealized losses.
Blockchain analytics support this interpretation. The Spent Output Profit Ratio for Ethereum has maintained readings above 1.0 throughout the past seven days, indicating that the majority of tokens transferred on-chain during this window were distributed at profitable levels.
However, institutional appetite through regulated investment vehicles continues unabated. United States-based spot Ethereum exchange-traded funds registered $234.51 million in net positive flows on August 27, building on $192.35 million the previous day and $179.80 million on August 25.
This uninterrupted nine-session inflow sequence elevated the seven-day aggregate to $722.24 million, representing the most robust weekly performance for Ethereum-focused funds in approximately ten months. Cumulative net inflows have reached $12.87 billion, with total assets under management now standing at $15.57 billion.

Large-Scale Accumulation Observed at Critical Price Level
A significant market participant deployed $13.55 million to acquire 5,425 ETH at an average execution price of $2,498, as documented by Lookonchain. This accumulation occurred precisely at the $2,500 resistance boundary that technical analysts are monitoring intensively.
Given that ETH now trades beneath this whale’s entry point, market observers are assessing whether sufficient buying pressure exists to reclaim the $2,500 level. Successfully maintaining prices above this zone would reinforce the prevailing bullish technical configuration.
Market analyst Daan Crypto Trades (@DaanCrypto) provided perspective on recent price behavior, observing that ETH established a higher weekly peak, which enhances overall market structure. He cautioned that a reversal below $2,300 would represent an unfavorable development for those holding long positions.
Inflows of dollar-denominated stablecoins have contributed additional liquidity infrastructure. More than $4.1 billion in stablecoin capital entered digital asset markets during the preceding two-week period, according to DefiLlama tracking data.
Network Utilization Metrics Trail Price Performance
On-chain engagement indicators have not matched the recent price appreciation. Both transaction volume and unique active wallet addresses have contracted over the previous seven days, suggesting the upward price movement lacks confirmation from expanding fundamental usage.
Futures and options markets demonstrate measured positioning. Aggregate open interest has not experienced substantial recovery following recent leverage liquidation events and short squeeze dynamics. Ethereum witnessed $97.3 million in forced position closures during the past day, with $75.8 million stemming from leveraged long positions.
The 14-day Relative Strength Index registers at 69, positioned just beneath territory typically classified as overbought. The Stochastic Oscillator reads 81, suggesting near-term momentum conditions may be reaching extension limits.
Total Ethereum open interest has climbed beyond $32 billion while cumulative trading volume exceeded $100 billion, based on Coinglass metrics. Primary technical zones requiring attention include upside resistance at $2,500 and foundational support near $2,146.
Get 3 Free Stock Ebooks
Discover top-performing stocks in AI, Crypto, and Technology with expert analysis.
- Top 10 AI Stocks - Leading AI companies
- Top 10 Crypto Stocks - Blockchain leaders
- Top 10 Tech Stocks - Tech giants


