



Key Takeaways
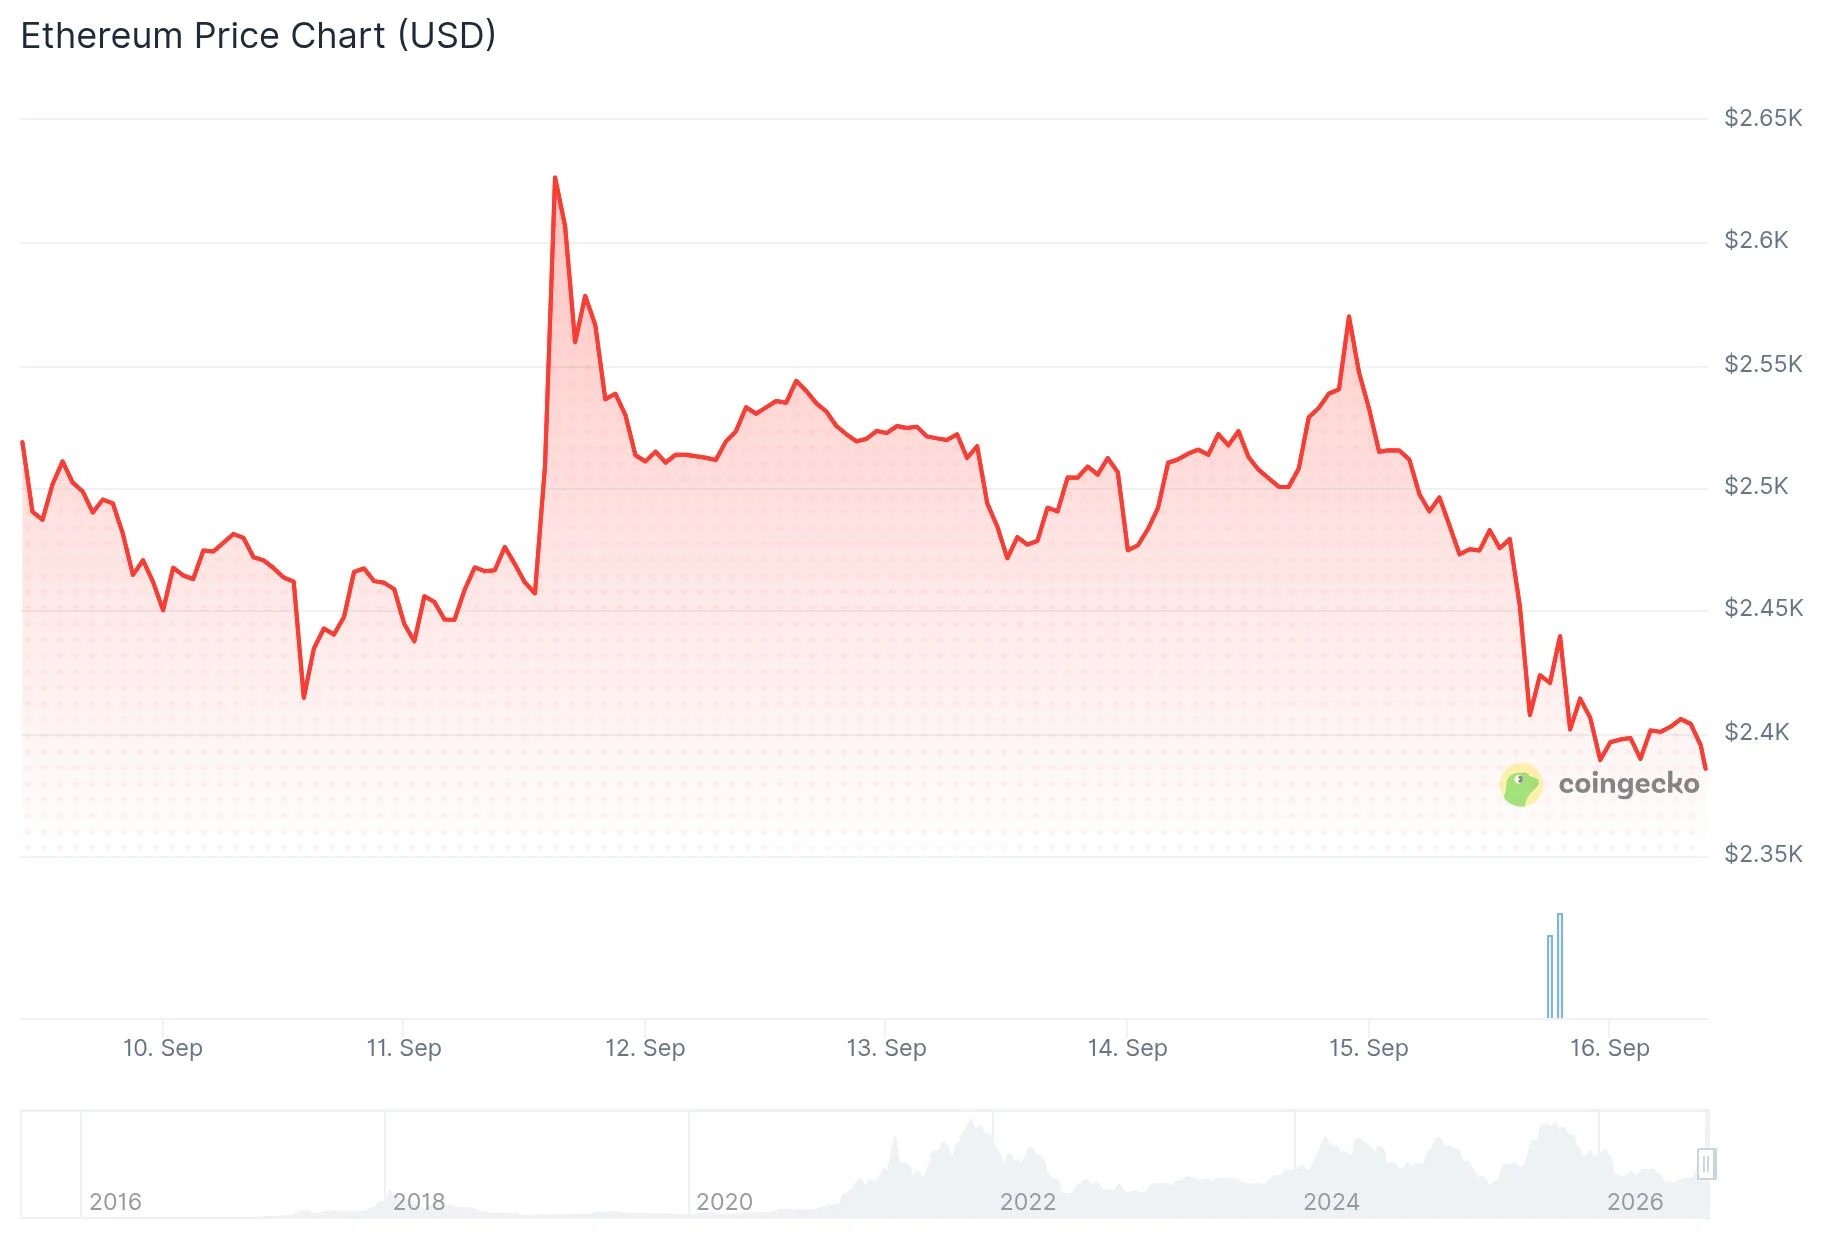
- Ethereum retreated to $2,400 following the Senate’s failure to pass the Clarity Act
- More than 140,000 ETH (approximately $350M) withdrew from exchanges over a 96-hour period, signaling reduced selling pressure
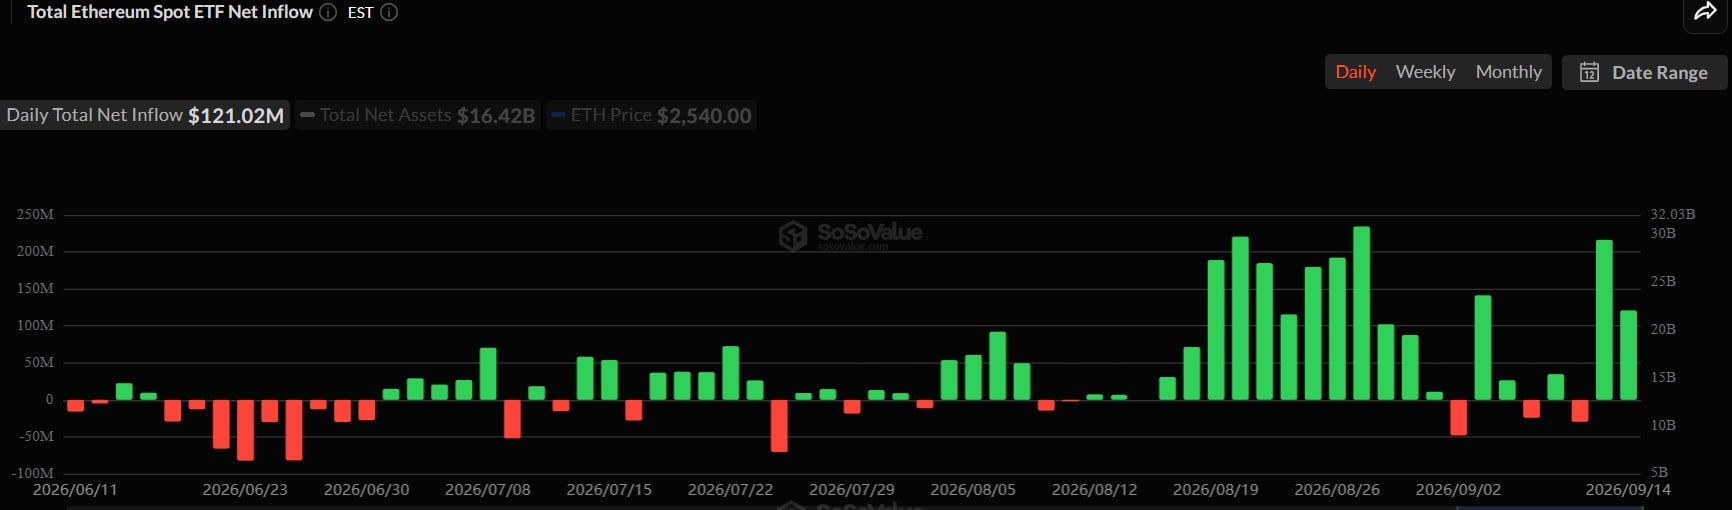
- Spot Ethereum ETFs in the United States attracted $121M this week, extending a five-week streak of positive flows
- Large holders accumulated approximately 200K ETH throughout the last seven days
- Critical support for ETH lies at $2,270 (50-day EMA) should the $2,431 level break
Ethereum’s price slipped toward the $2,400 mark on Tuesday following the Senate’s inability to advance the CLARITY Act, which fell short of the required 60-vote threshold. Republican senators blocked amendments proposed by Democrats, sparking a 5% decline in ETH. However, blockchain metrics paint a different picture beneath the surface volatility.
Data tracking exchange movements reveals that more than 140,000 ETH — valued at approximately $350 million — was withdrawn from trading platforms during a four-day span. Crypto analyst Ali Martinez highlighted this development on X, stating: “With less $ETH available on exchanges, potential sell-side pressure is declining, strengthening the case for a bullish breakout.” According to Santiment, exchange balances have plummeted from 22.9 million ETH in June 2020 to merely 6.06 million today. This reduction stems from staking participation, ETF custody, and corporate treasury accumulation, including Bitmine’s holdings which now represent 4.9% of Ethereum’s circulating supply.
Large holders — addresses controlling between 10K and 100K ETH — increased their combined positions by roughly 200K ETH during the previous week. Meanwhile, smaller retail wallets distributed approximately 192K ETH over the identical timeframe, maintaining a distribution pattern observed throughout this year.
Institutional Capital Continues Flowing Into Ethereum ETFs
Spot Ethereum exchange-traded funds in the United States registered $121 million in net inflows on Monday, representing the second consecutive session with positive flows. The preceding Friday brought $216.4 million into ETH ETFs, notably occurring while Bitcoin ETFs experienced withdrawals. This performance extends a five-week winning streak for Ethereum ETF inflows beginning the week of August 21.
Outstanding contracts on Deribit surged to $11.77 billion in anticipation of the Federal Reserve announcement, gaining $700 million since September 12. Meanwhile, Binance’s long-to-short ratio reached 3.10 — the most elevated level recorded since June 2026 — indicating traders are overwhelmingly positioned for upward movement ahead of the Fed’s rate decision.

Market analyst IncomeSharks commented on X that ETH appears to be repeating a recognizable pattern: “Fakeout above, fakeout below, run it back. Same playbook as last time,” referencing previous consolidation phases. In a separate observation, analyst Ted reported on X that a significant holder liquidated $64 million worth of Bitcoin and deployed the entire proceeds into ETH.
Critical Support and Resistance Zones
Ethereum is presently trading beneath its 20-day EMA at $2,435 and the $2,431 support threshold. The Relative Strength Index hovers around 51, while the Stochastic indicator has entered oversold conditions.
Should ETH be unable to recover the $2,431 level, the subsequent support zone emerges at the 50-day EMA around $2,270, with the 200-day EMA positioned at $2,266 immediately below. A daily close beneath $2,380 would potentially trigger a test of the $2,200 region.
The Binance long/short ratio standing at 3.10 combined with five uninterrupted weeks of ETF capital inflows represent the strongest bullish indicators currently available in market data.
Get 3 Free Stock Ebooks
Discover top-performing stocks in AI, Crypto, and Technology with expert analysis.
- Top 10 AI Stocks - Leading AI companies
- Top 10 Crypto Stocks - Blockchain leaders
- Top 10 Tech Stocks - Tech giants


