



Key Highlights
- US spot Ethereum ETFs witnessed $70.62 million in net outflows on Friday, ending a five-day positive streak
- Despite Friday’s reversal, ETH ETFs accumulated $103.9 million in weekly inflows, marking the third consecutive positive week
- The ETH/BTC ratio fell to 0.028, marking its weakest performance versus Bitcoin since August of last year
- Current ETH trading occurs beneath its aggregate cost basis of $2,304, a zone that historically exhausts selling pressure
- Critical bottom indicators including MVRV ratios and exchange flow patterns haven’t reached extreme thresholds that typically signal definitive floors
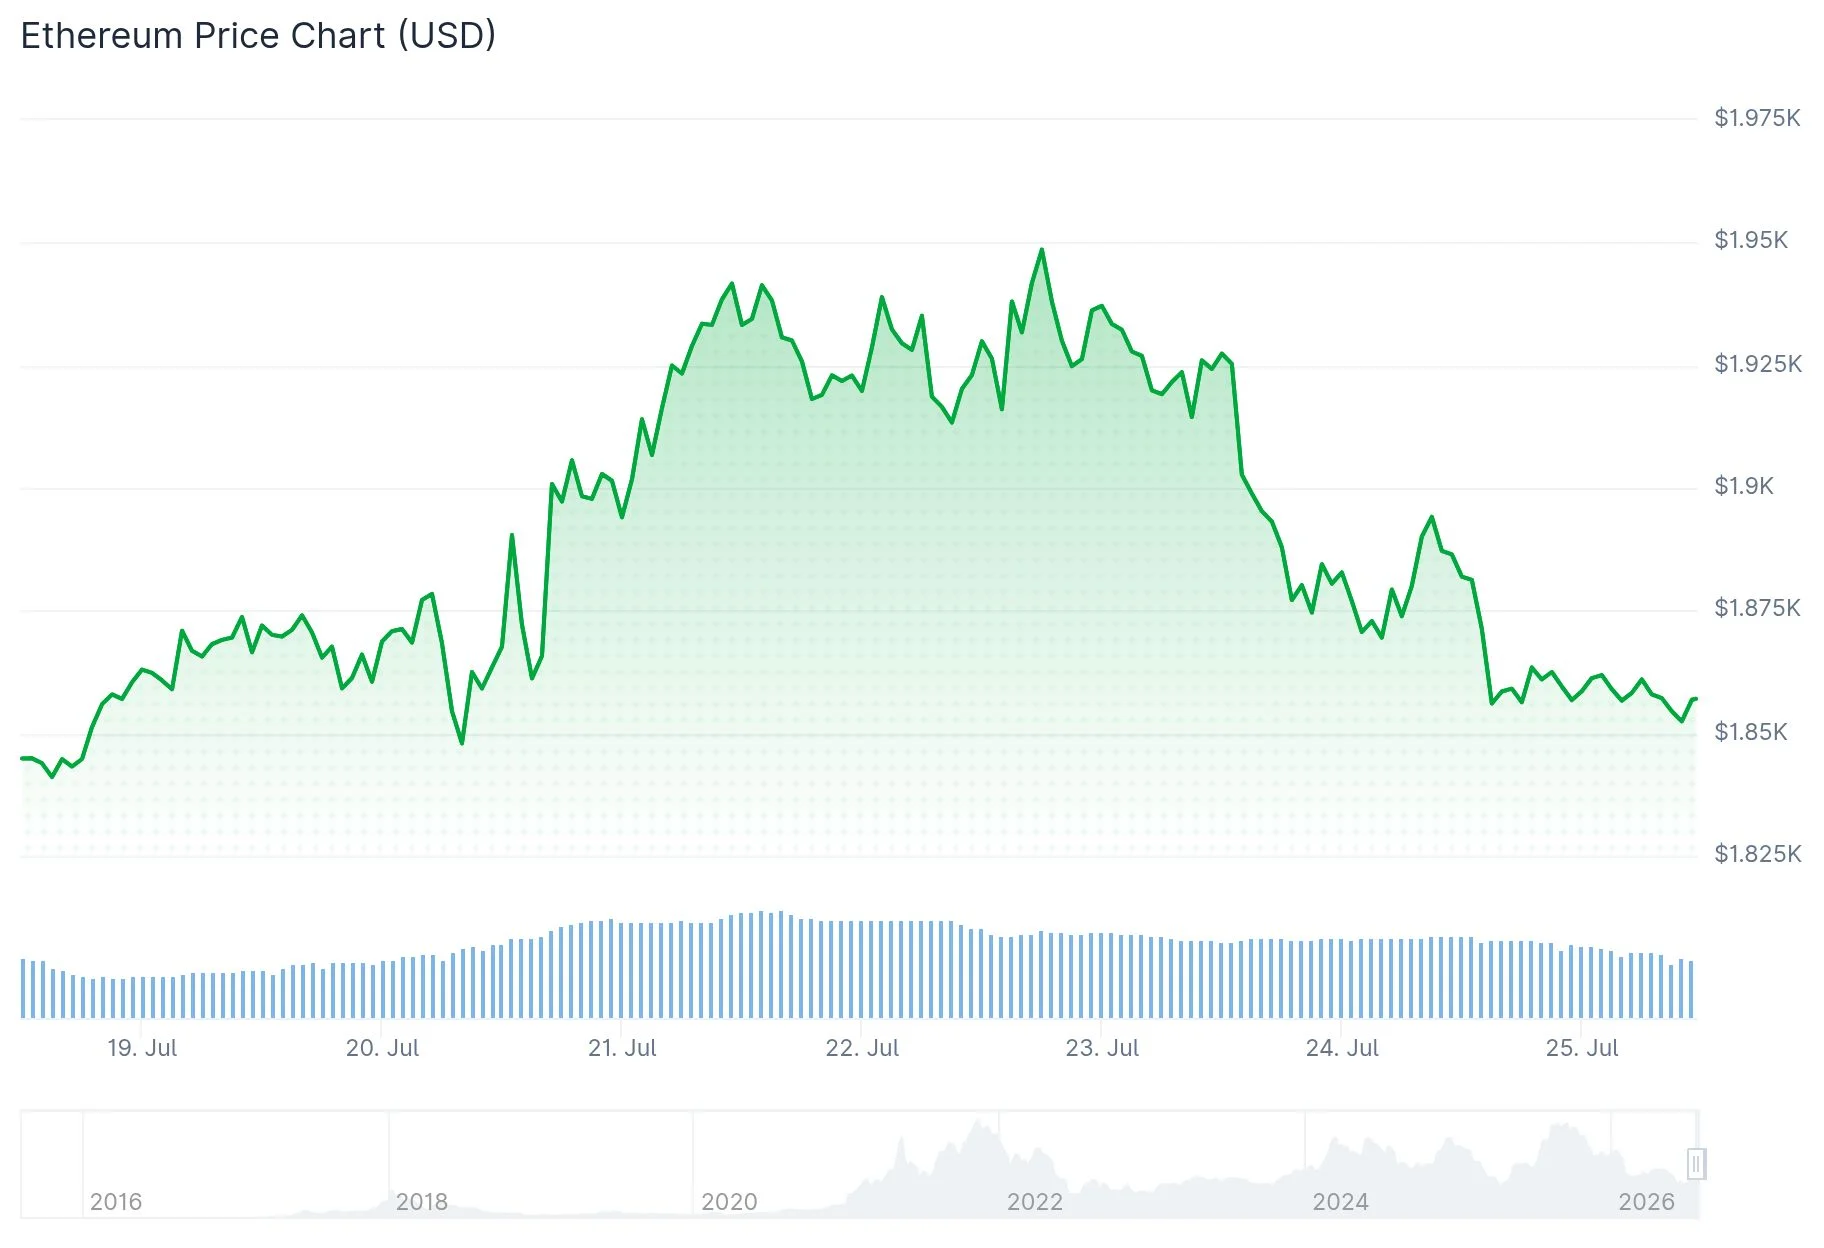
Ethereum (ETH) closed the week at $1,837 following a significant shift in US-listed spot Ethereum ETF flows. On Friday, July 25, these investment vehicles recorded $70.62 million in net outflows, terminating a consecutive five-day period of positive inflows that had accumulated $211.25 million from July 17 through July 24.
Looking at the broader picture, Ethereum ETFs maintained a positive weekly performance with $103.9 million in cumulative net inflows. This marks the third straight week of positive institutional demand. For July overall, ETH ETFs have now accumulated $337.74 million in total inflows.
Bitcoin ETFs experienced a comparable trajectory. These products saw $240.08 million exit on Friday, concluding a seven-day positive flow period. BTC hovered just below $64,000, retreating from Tuesday’s weekly peak of $66,892.
Market analyst Ted (@TedPillows) commented via social media that ETH continues maintaining its support zone. His assessment suggests Ethereum demonstrates relative strength versus Bitcoin, indicating the current rally cycle may have additional momentum remaining.
ETH has experienced substantial decline from its peak of $4,946 reached last year, bottoming at $1,400 in June before staging a recovery. The current price sits approximately 17% beneath its realized price—the network-wide average acquisition cost—calculated at $2,304.

On-Chain Bottom Indicators: Current Analysis
A Thursday analysis from CryptoQuant suggests Ethereum displays preliminary bottom formation characteristics, though the complete set of confirmation signals required for sustainable upward movement remains absent.
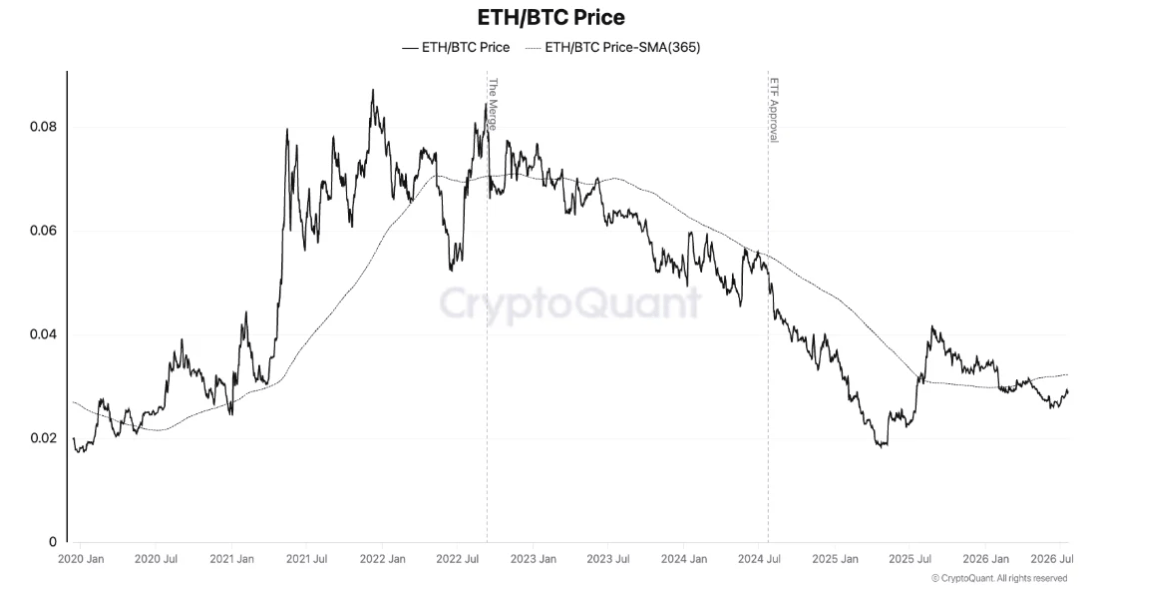
The ETH/BTC trading pair has declined to 0.028, representing its weakest reading since August of the previous year. While such relative weakness against Bitcoin has historically signaled upcoming altcoin rally phases, market analysts emphasize additional confirmation remains necessary.
The ETH/BTC MVRV ratio has contracted from 0.95 last August to approximately 0.65 currently. According to CryptoQuant’s historical analysis, sustained bottoms generally establish when this metric falls below 0.45, a threshold observed during 2019-20 and early 2025 market cycles.
Critical Technical Price Zones for ETH
Ethereum presently tests its 20-day and 50-day Exponential Moving Averages (EMAs) positioned at $1,839 and $1,831 respectively. A decisive break beneath these technical levels could reveal support around $1,806, followed by $1,741.
Liquidation activity in ETH totaled $67.79 million during the past 24 hours, with long position liquidations accounting for $44.18 million of that figure.
Among bottom indicators, one metric has already triggered. The ETH/BTC relative spot trading volume has contracted from 1.75 in August to approximately 0.5, a threshold that historically correlates with Ethereum price bottoms.
Institutional appetite through ETF channels has begun shifting direction. The ETH/BTC ETF holdings ratio recovered to 0.13 in July following its June decline to 0.115.
Get 3 Free Stock Ebooks
Discover top-performing stocks in AI, Crypto, and Technology with expert analysis.
- Top 10 AI Stocks - Leading AI companies
- Top 10 Crypto Stocks - Blockchain leaders
- Top 10 Tech Stocks - Tech giants


