
 Price Eyes $3,000 Milestone as Whale Accumulation Reaches All-Time High")
Key Highlights
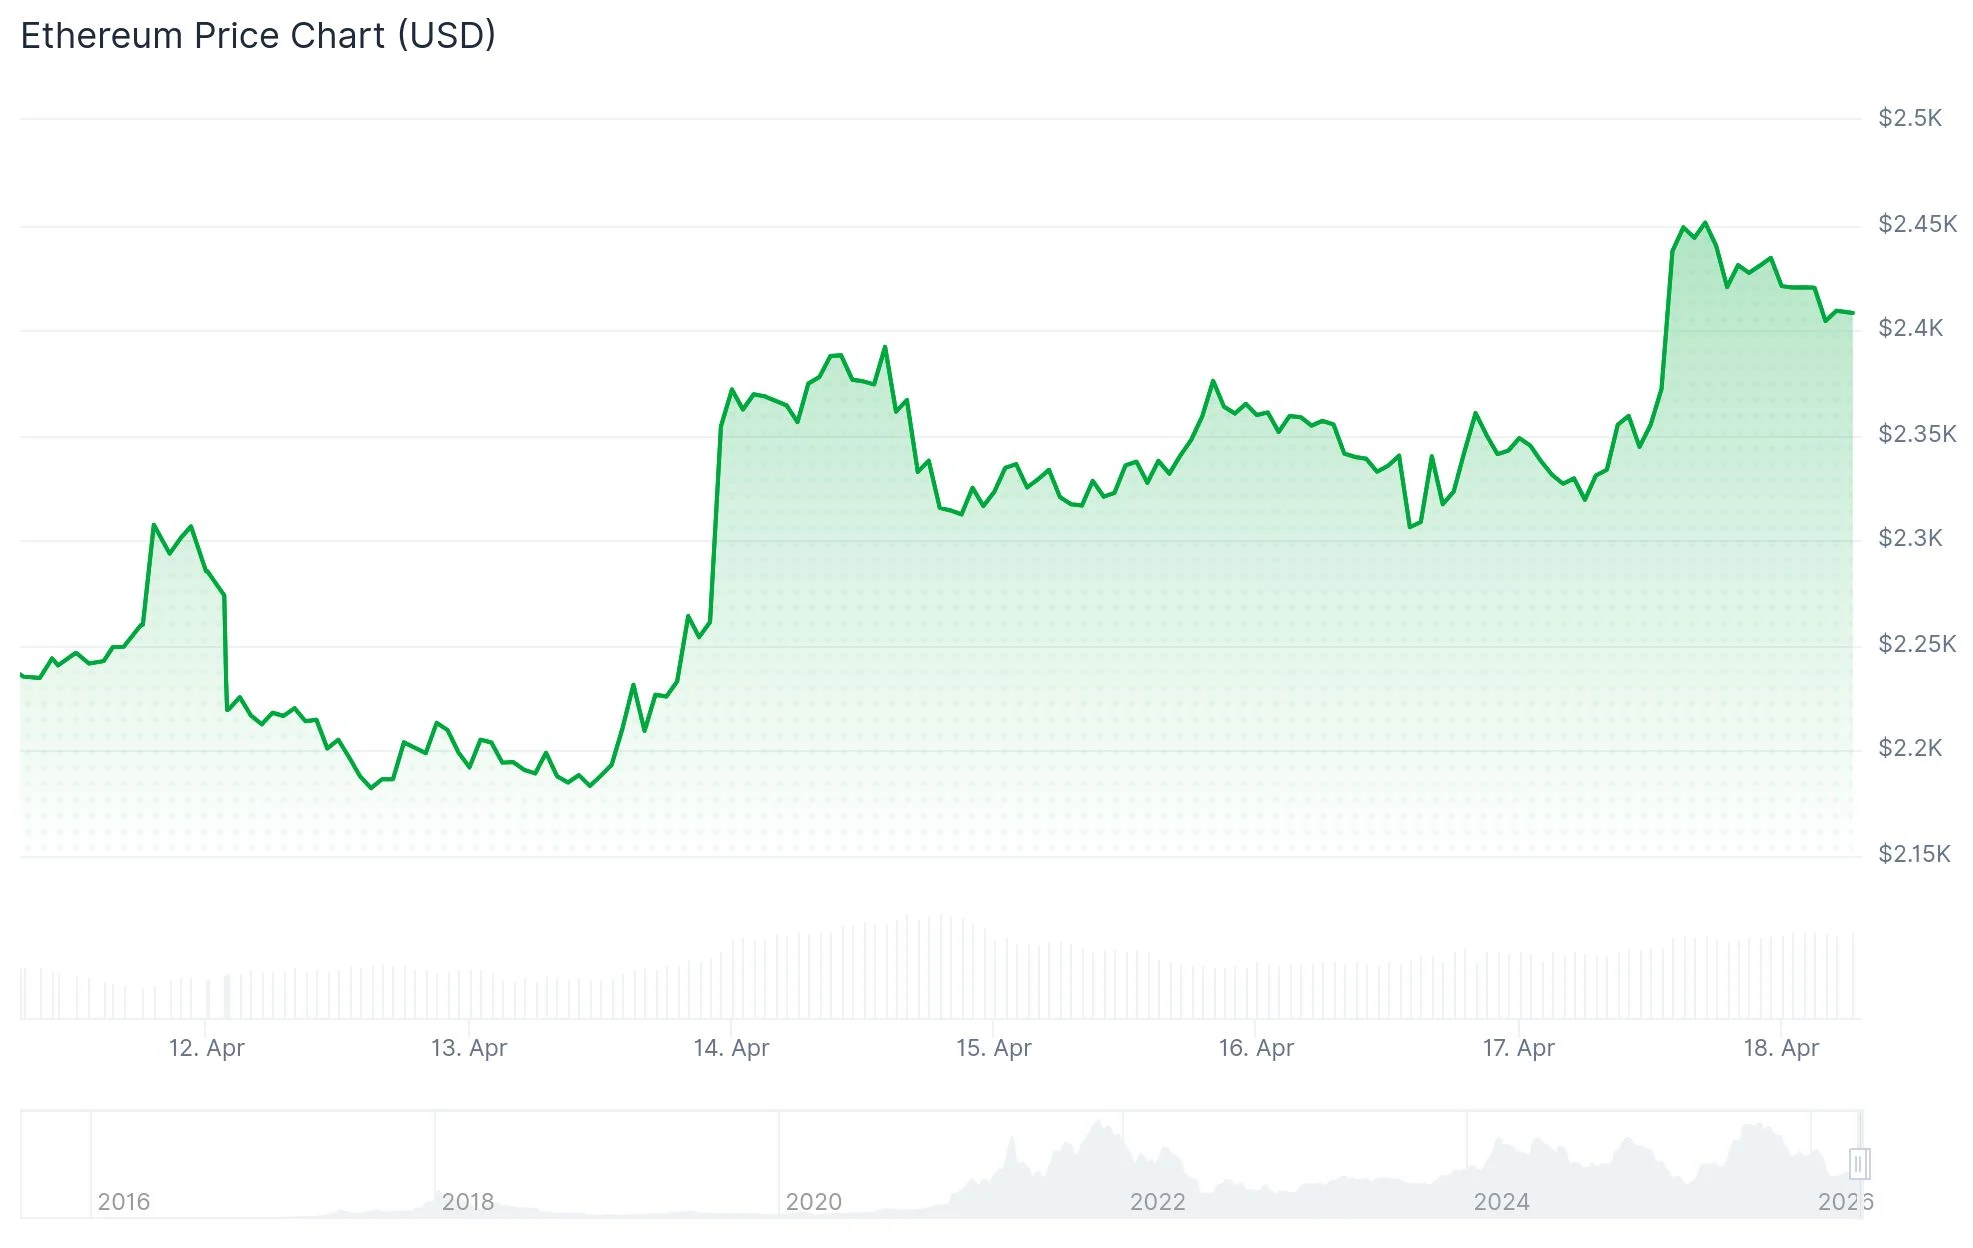
- ETH has surged past $2,400, marking a 38% gain from its recent low of $1,750
- Wallets dedicated to accumulation have increased their holdings by 33%, adding 6.5 million ETH since the start of the year
- Technical analysis reveals a cup-and-handle formation with a price objective between $2,960 and $3,150
- Ethereum ETFs have recorded positive net inflows for seven trading sessions in a row, totaling $298.4 million
- Reduced geopolitical tensions following Iran’s decision to reopen the Strait of Hormuz provided additional support to ETH’s upward momentum
Ethereum has successfully breached the $2,400 level, extending a bullish reversal that began from a swing low of $1,750. This rally represents approximately a 38% appreciation from that recent bottom. Multiple on-chain metrics and technical indicators are now capturing the attention of market participants and crypto analysts.
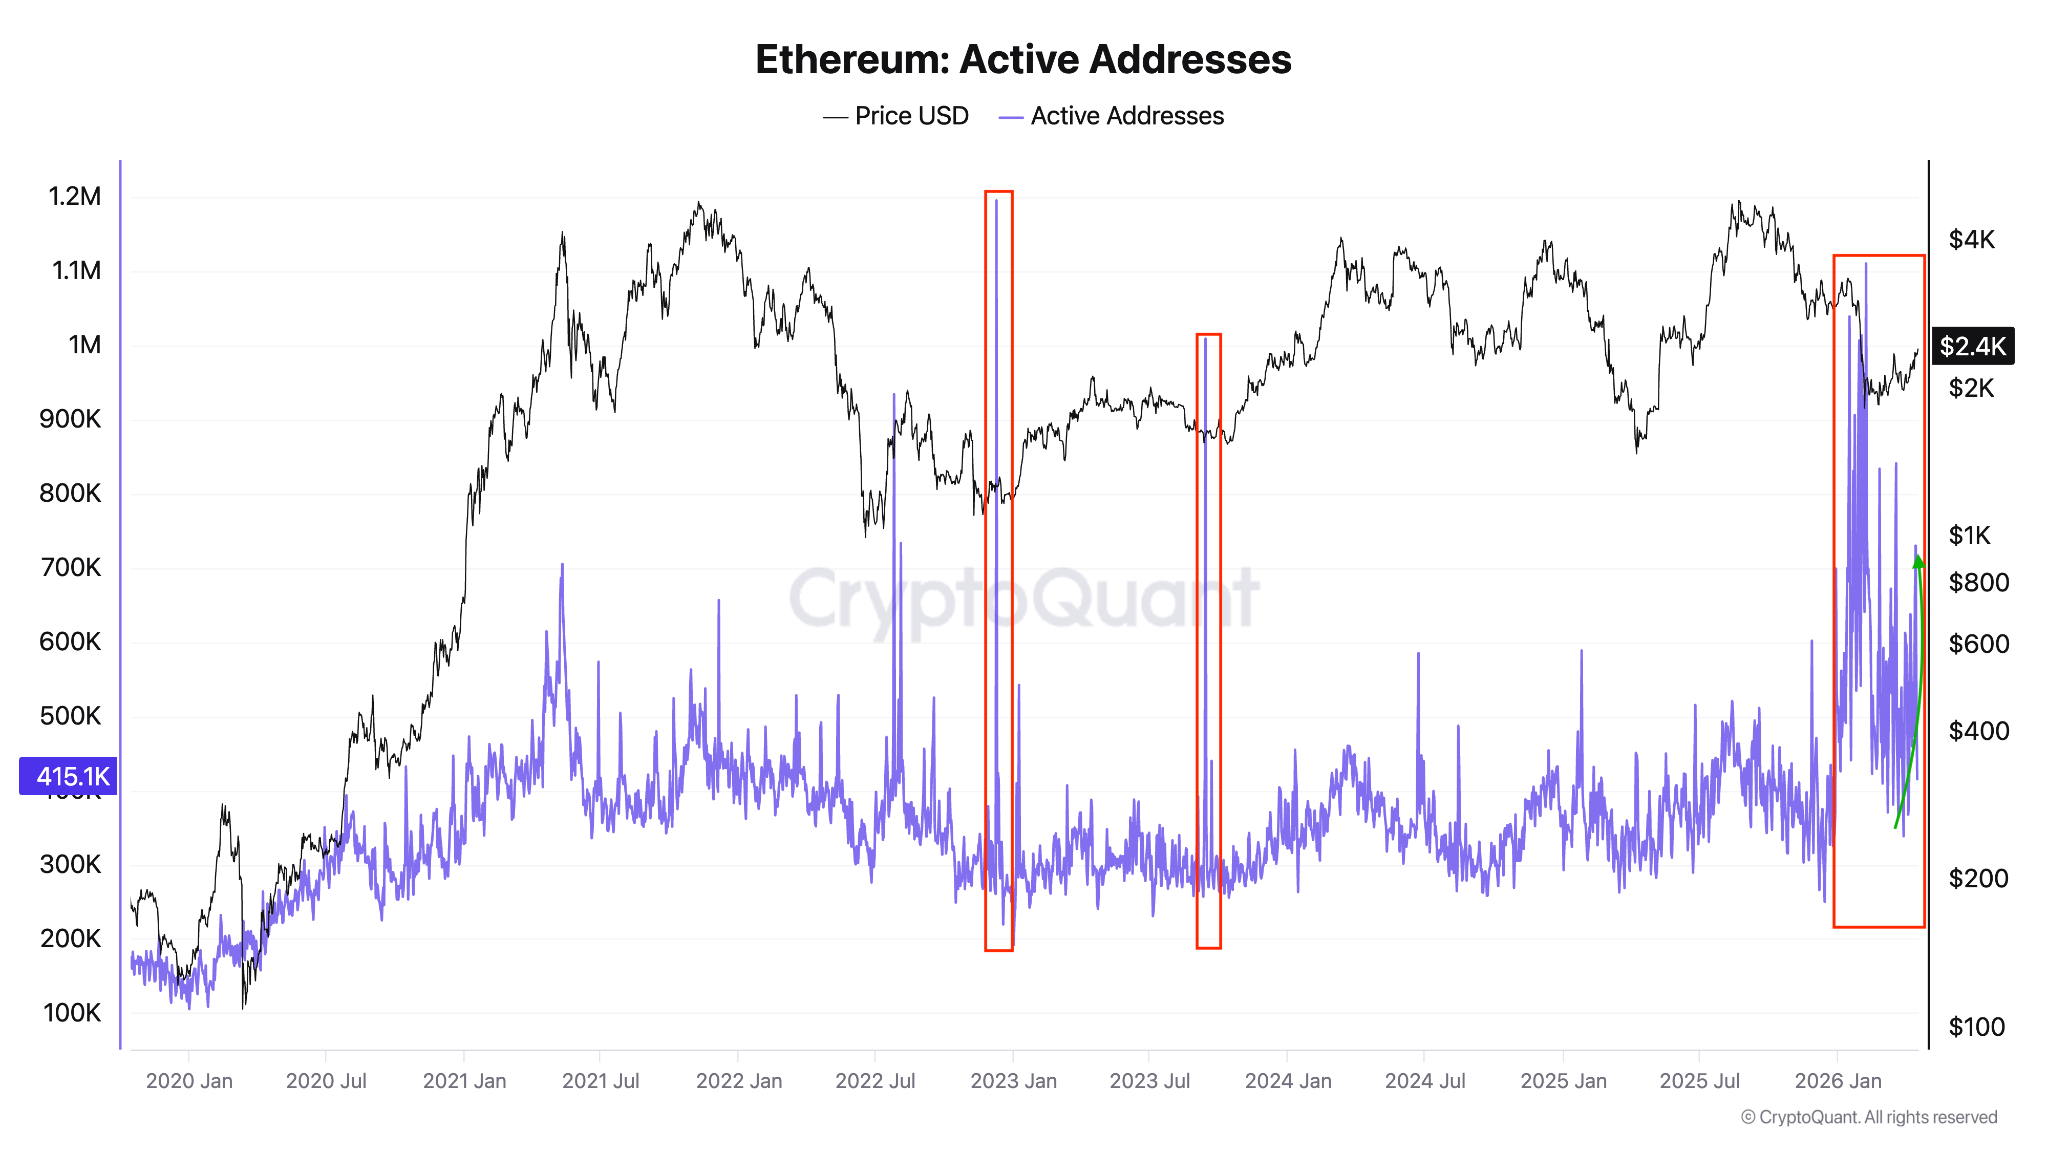
Network activity on Ethereum experienced a dramatic surge, with daily active addresses climbing 89% from 384,763 to 730,278 on April 5. Historically, similar spikes in activity have coincided with market bottoms, including notable instances in 2022 that preceded substantial price recoveries.
Accumulation addresses recorded their highest daily inflow of 1.14 million ETH in November 2025. Throughout 2026, these addresses have maintained an average daily inflow of 200,000 ETH, with a notable surge to 358,000 ETH registered on Thursday.
The cumulative balance held in accumulation wallets — defined as addresses with no recorded selling history — has expanded from 19.64 million to 26.16 million ETH since January 1. This represents a substantial 33% increase over the period.
Currently, 39.2 million ETH is locked in staking contracts. Simultaneously, ETH holdings on centralized exchanges have declined to multi-year lows, significantly reducing the available liquidity in spot markets.

Technical Formation Projects $3,150 Target
From a technical perspective, ETH has completed a breakout from a cup-and-handle formation visible on the 12-hour chart. A sustained close above the pattern’s neckline at $2,400 establishes a measured move target near $2,960. The 14-day Relative Strength Index currently registers between 65 and 68, indicating strong bullish momentum without entering overbought territory.
Crypto analyst TheSkayeth highlighted a more extensive cup-and-handle pattern developing over a two-month period on the daily timeframe. The trader noted that ETH was “setting up for a massive move” and suggested that successful pattern completion would propel prices into the “golden zone.” The calculated target from this larger formation extends to $3,150.
Institutional Demand Returns Through ETF Vehicles
Spot Ethereum ETFs have maintained positive net flows for seven consecutive trading sessions, accumulating a combined $298.4 million in inflows, based on data from SoSoValue. Specifically on April 17, spot Ethereum ETF products recorded $127 million in net inflows, as reported by Wu Blockchain.
Ethereum’s price performance also benefited from diminishing geopolitical risks. Iran’s announcement regarding the reopening of the Strait of Hormuz, following ceasefire developments involving the United States and Lebanon, helped ease market concerns. ETH is currently trading above its on-chain realized price of $2,308, indicating aggregate profitability for holders.
The Moving Average Convergence Divergence (MACD) indicator on ETH’s weekly chart has generated a golden cross signal — a historically significant development that previously marked price bottoms in November 2024 and May 2025.
Open interest across Ethereum derivatives markets has expanded to 14.67 million ETH. Funding rates have shifted into negative territory, suggesting that short sellers are establishing positions in anticipation of a potential pullback. During the past 24 hours, liquidations totaling $163.2 million occurred in ETH positions, with $140.9 million attributed to short positions being forced to close.
ETH’s nearest support level is positioned at the 100-day Exponential Moving Average around $2,378. Overhead resistance zones are located at $2,746, with a more substantial barrier at $3,411.
Get 3 Free Stock Ebooks
Discover top-performing stocks in AI, Crypto, and Technology with expert analysis.
- Top 10 AI Stocks - Leading AI companies
- Top 10 Crypto Stocks - Blockchain leaders
- Top 10 Tech Stocks - Tech giants

