
 Price: Institutional Players Accumulate as Key Resistance Levels Emerge")
Key Takeaways
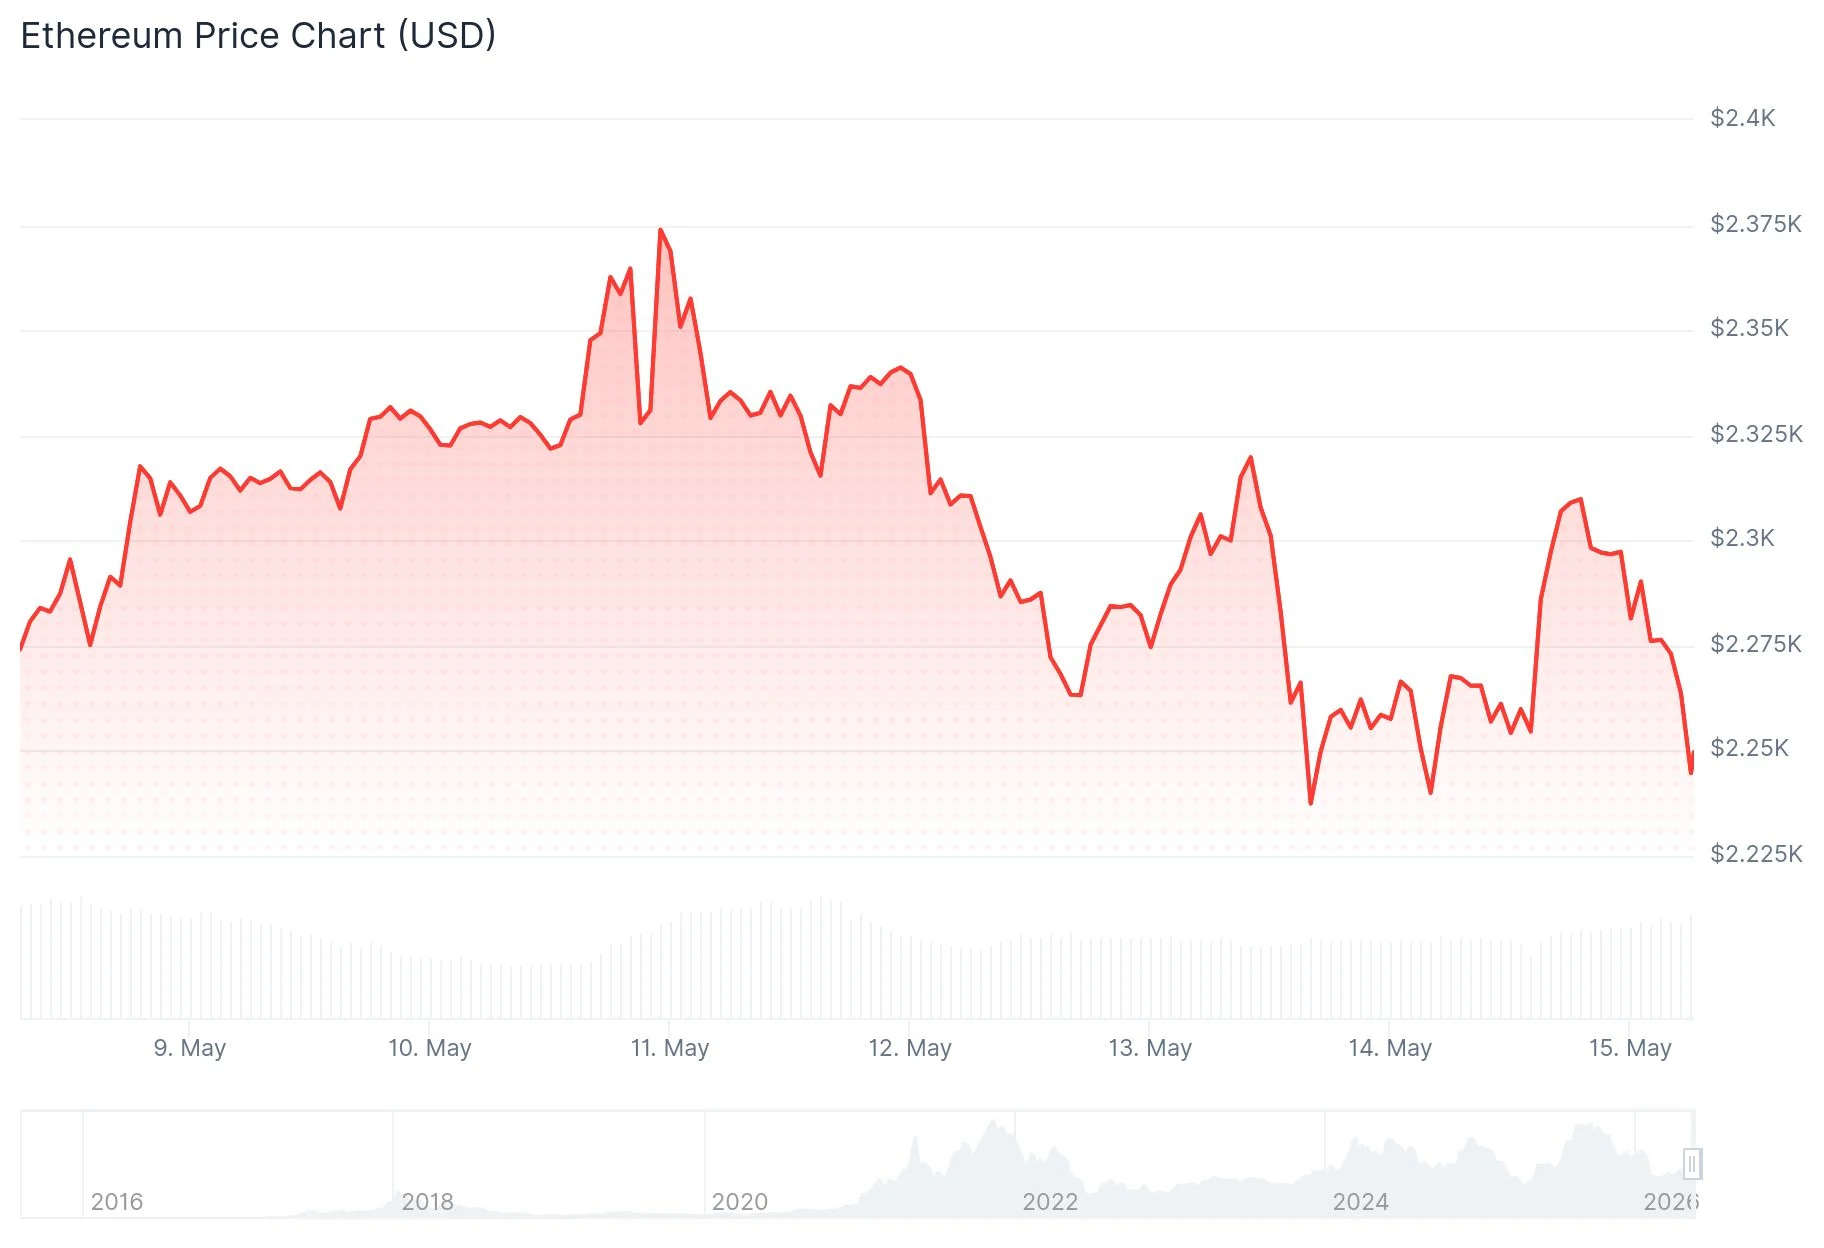
- ETH maintains a price of $2,316.20, gaining 2.08% over the previous 24-hour period
- Investment giant Jane Street boosted Ethereum ETF holdings by approximately $82 million during Q1 2026
- Significant whale sell orders positioned near $2,320 and $2,400 create upside obstacles
- Technical analysts identify $2,323 as the critical breakout threshold for bullish continuation
- The 50-day moving average at $2,247 represents crucial underlying support
Ethereum continues to defend the $2,300 threshold amid a developing tug-of-war between increasing institutional accumulation and substantial whale-driven resistance.
Currently, ETH sits at $2,316.20, representing a 2.08% increase from the prior 24-hour session. The asset shows $24.12 billion in daily trading activity, maintaining a market capitalization of $277.94 billion.
Market analyst Ted Pillows highlighted on X that ETH recently confirmed support around the $2,250 zone. According to his assessment, maintaining this foundation could propel Ethereum toward the $2,350–$2,400 range, while a breakdown might trigger a descent toward $2,150 or even lower levels. This analysis aligns with current technical chart formations.
On the institutional front, major financial player Jane Street expanded its Ethereum ETF allocation by roughly $82 million during the first quarter of 2026. Notably, this move coincided with the firm trimming exposure to Bitcoin and MicroStrategy holdings.
Major Resistance Zones Created by Whale Activity
Crypto market analyst CW identified substantial sell pressure from Binance whales positioned around $2,400. Additionally, Coinbase whales have established a resistance point near $2,320. These layered selling zones are effectively capping Ethereum’s upward momentum attempts.

ETH rebounded from its recent floor around $2,233 but continues facing challenges in sustaining higher price levels. The $2,320 threshold represents the initial hurdle that bulls must overcome.
On May 14, blockchain analytics platform Alphractal observed that Ethereum’s “Realized Cap Impulse” metric maintained positive territory despite a 3% price decline. This indicates that new capital continues flowing into the network, even during periods of price weakness.
Technical Analysis Breakdown
The Relative Strength Index currently registers at 49.94, hovering just beneath the neutral 50 threshold. The 50-day moving average stands at 52.88. Meanwhile, the MACD indicator shows the main line at 8.29, positioned below the signal line at 17.92, with a negative histogram reading of -9.63—suggesting weakening near-term momentum.
Market technician More Crypto Online indicates that ETH’s Elliott wave structure points toward an ongoing corrective formation. The $2,220–$2,230 region emerges as the critical support zone that buyers must successfully defend.
Should ETH fail to penetrate above $2,323, chart patterns indicate potential revisitation of lower trend support levels. Conversely, a successful breakout would establish $2,380 as the subsequent resistance objective.
Current market data confirms ETH stabilizing around $2,316, with institutional capital inflows persisting as traders monitor critical technical thresholds closely.
Get 3 Free Stock Ebooks
Discover top-performing stocks in AI, Crypto, and Technology with expert analysis.
- Top 10 AI Stocks - Leading AI companies
- Top 10 Crypto Stocks - Blockchain leaders
- Top 10 Tech Stocks - Tech giants

