
 Price Trapped in Month-Long Range — What Triggers the Next 10% Move?")
Key Takeaways
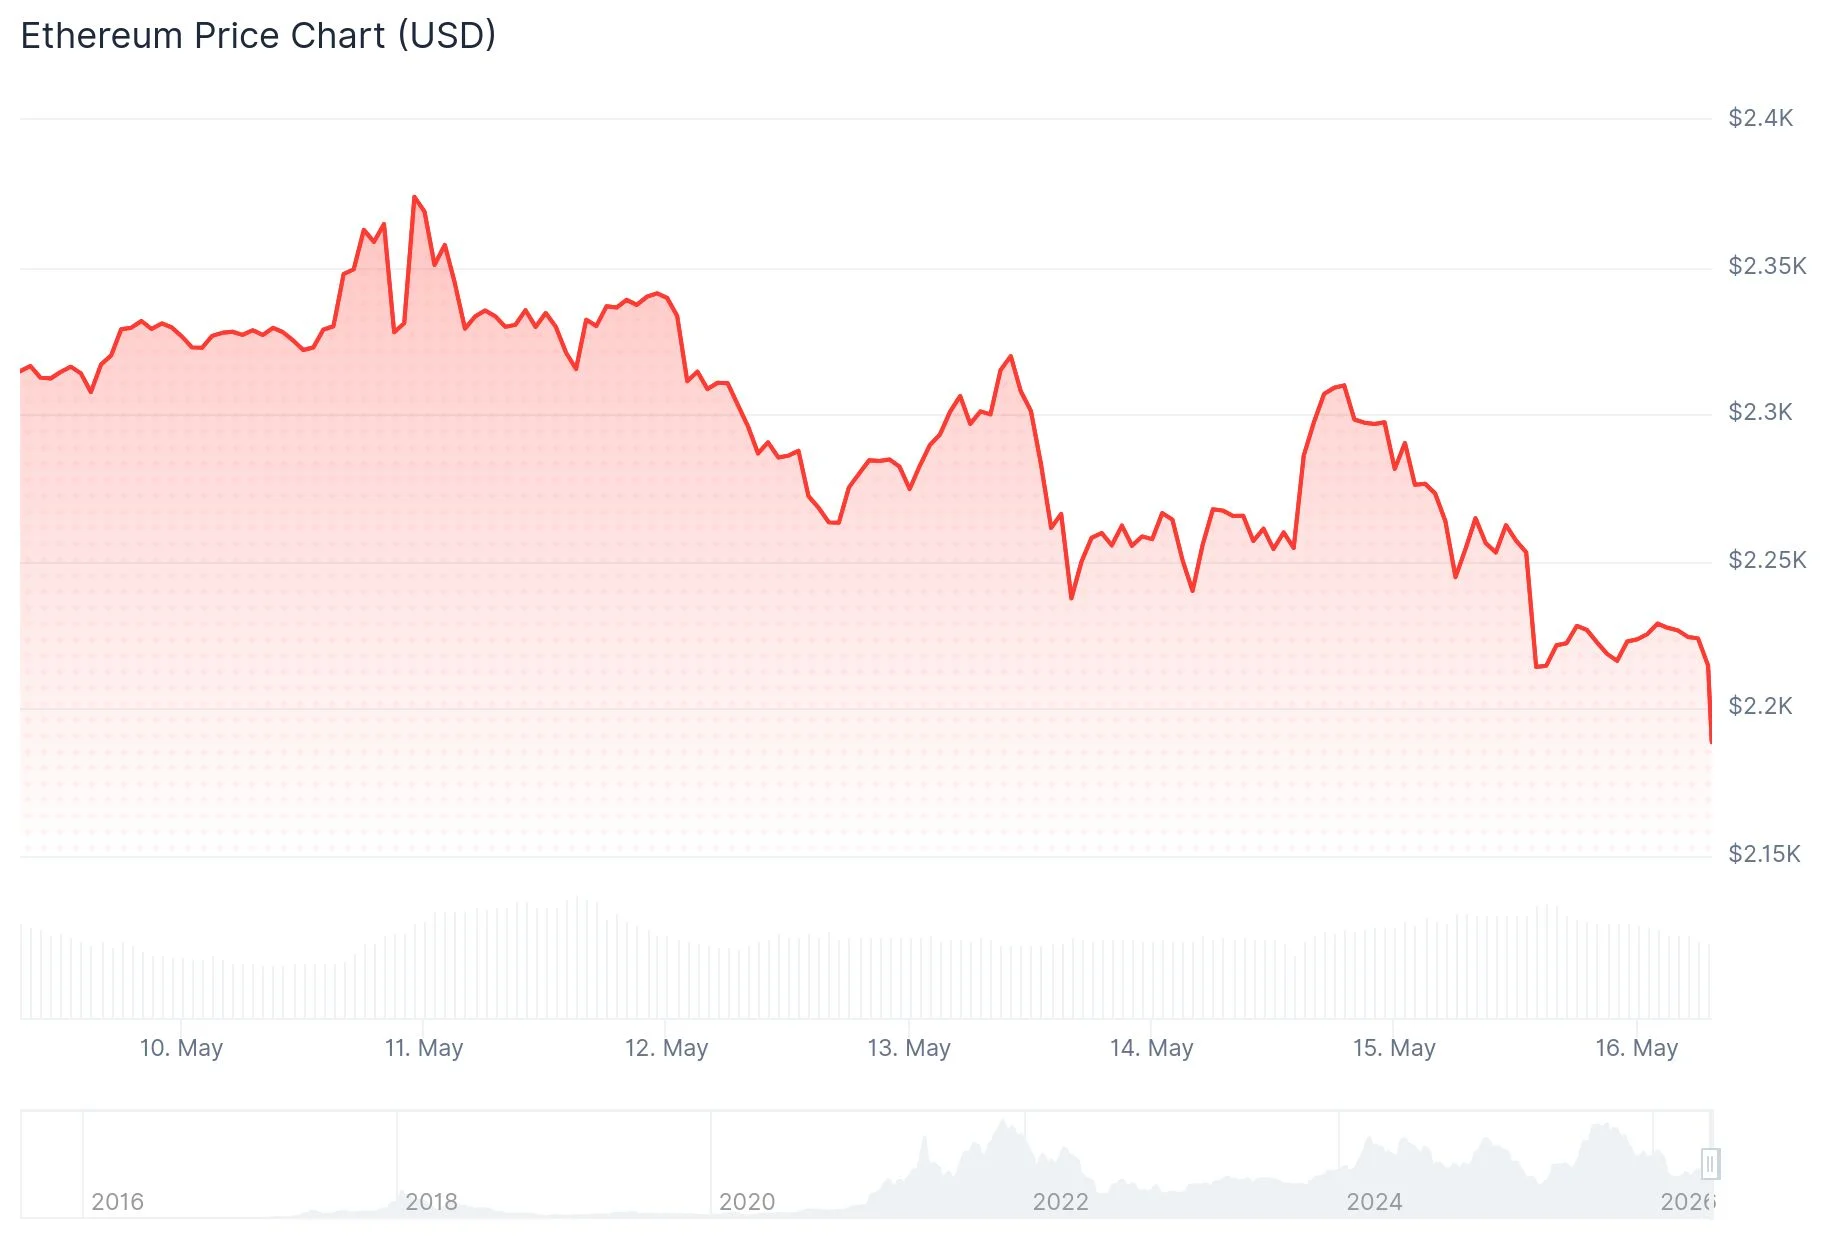
- Ethereum currently trades between $2,226–$2,263, reflecting a decline of approximately 3.74–5.5% in recent sessions.
- Technical indicators show deteriorating momentum, with RSI falling beneath 50 and MACD turning negative.
- Crypto analyst Ali Charts identified $1,071 as a compelling accumulation level at the channel’s lower boundary.
- Price action has remained confined within a $2,250–$2,380 corridor for approximately 30 days; either directional break may spark a move exceeding 10%.
- Analyst Crypto Patel’s extended outlook targets $5,000, $10,000, and $15,000, identifying $1,500–$2,000 as an optimal accumulation window.
Ethereum continues to experience downward pressure as technical momentum deteriorates. The second-largest cryptocurrency has retreated approximately 3.74% during the last 24-hour period, currently oscillating between $2,226 and $2,263 based on CoinMarketCap data.
Trader Symba observed that ETH has begun responding to its established trading range, suggesting that sustained strength in global equity markets—especially the S&P 500—could provide upward momentum for both Bitcoin and Ethereum. His technical chart illustrated ETH breaking through a near-term declining trendline while maintaining support at the range’s lower threshold.
Analyst Ace pointed out that buyers emerged following a liquidity sweep at $2,241.73. The asset subsequently rallied into a $2,306.87 demand zone where substantial buying absorption occurred before additional upside materialized. Current support appears anchored around the $2,240–$2,250 region.
Blockchain analytics from Santiment provided additional context. Despite a roughly 5.5% three-day decline, Ethereum’s network registered its most substantial realized profits in three weeks, totaling approximately $74.58 million. Santiment’s analysis suggests the selling originated from long-term holders with low acquisition costs rather than from fearful market participants.
Technical Indicators Flash Warning Signs
The Relative Strength Index currently registers 43.22, having crossed below the critical 50 threshold. The MACD indicator reads -13.71, positioned beneath its signal line at 0.52, while the histogram displays red bars. These metrics collectively suggest diminishing buying pressure and a potential retest of the 100-day moving average positioned near $2,145.

Crypto analyst Patel referenced Ethereum’s rainbow chart framework, indicating that ETH presently occupies what he characterizes as a “cheap zone”—a valuation level historically observed rarely before significant rallies toward upper “take profit” bands. His preferred accumulation range spans $1,500–$2,000, with extended price objectives at $5,000, $10,000, and $15,000.
Meanwhile, analyst Ali Charts presented a more conservative near-term perspective, posting that $1,071 at the channel’s floor represents an attractive entry point for ETH accumulation.
Critical Range Holds the Key to Next Directional Move
Analyst Daan Crypto Trades provided clear context for the current market structure. Ethereum has remained locked within a $2,250–$2,380 band for nearly four weeks, with buyers consistently defending the lower boundary while sellers repeatedly reject advances above the upper limit.
A decisive breakout above $2,380–$2,400 would transfer momentum control to buyers, potentially opening pathways toward $2,500 and the unfilled CME gap at $2,640. Conversely, a breakdown beneath $2,250 would empower sellers and likely trigger extended consolidation at lower levels.
Current 24-hour trading activity registers $33.17 billion, supporting a total market capitalization of $268.45 billion.
Get 3 Free Stock Ebooks
Discover top-performing stocks in AI, Crypto, and Technology with expert analysis.
- Top 10 AI Stocks - Leading AI companies
- Top 10 Crypto Stocks - Blockchain leaders
- Top 10 Tech Stocks - Tech giants

