



TLDR
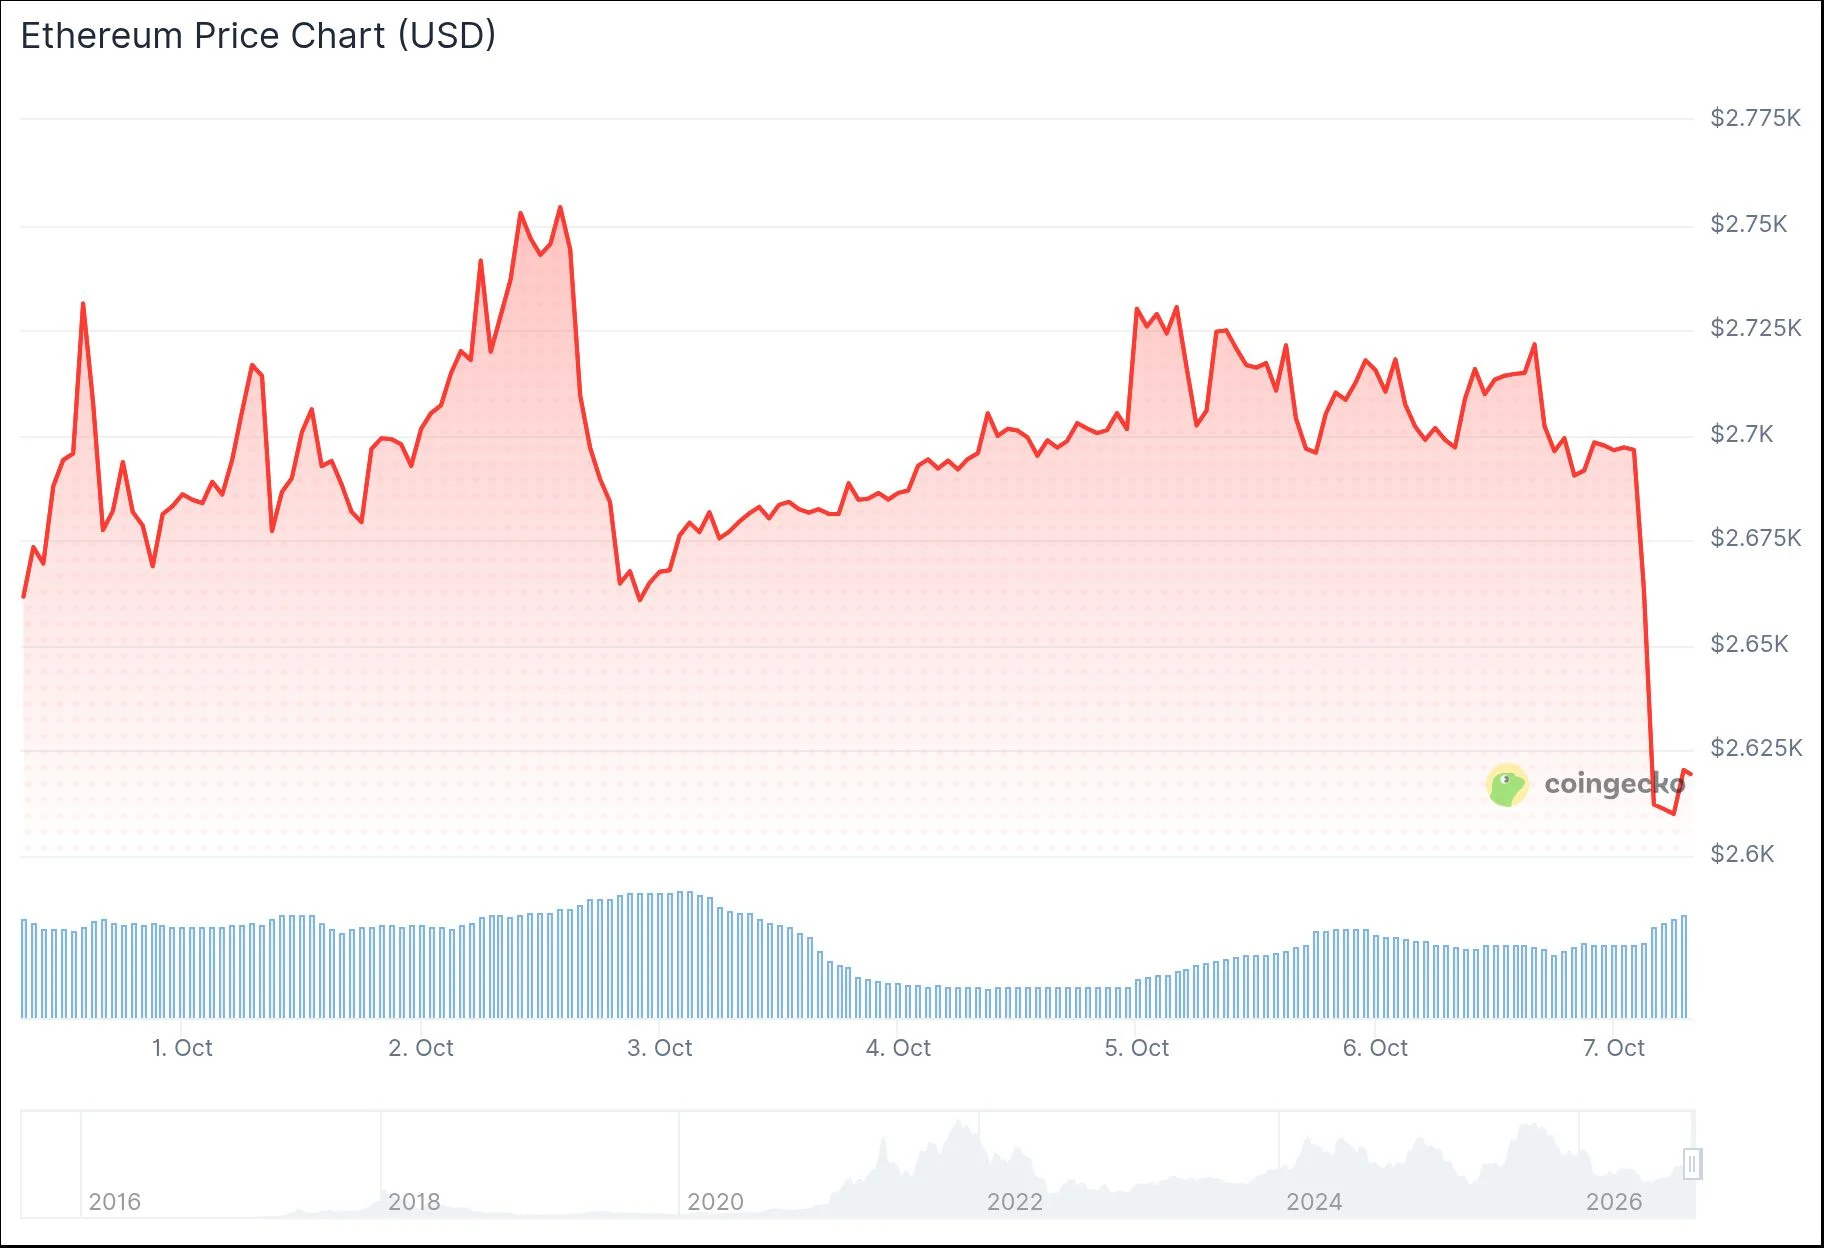
- Ethereum hovers around $2,617 following a sharp decline beneath the $2,600 threshold
- Glamsterdam network upgrade went live on Sepolia testnet this Tuesday
- Six consecutive days of withdrawals from Ethereum ETFs have drained $207 million
- Forced liquidations wiped out more than $400 million in leveraged long positions in a 20-minute window
- Technical analysts project potential downside to $2,400–$2,600 before any rally toward $3,400
Ethereum (ETH) is currently trading near $2,617 following a significant pullback that pushed the cryptocurrency below the psychologically important $2,600 level. This decline followed a period of consolidation where the asset remained range-bound between $2,650 and $2,750.
The downturn coincided with Tuesday’s deployment of Ethereum’s Glamsterdam upgrade to the Sepolia testnet. This marks an important milestone in the upgrade’s journey toward eventual mainnet implementation.
Glamsterdam represents a merger of two distinct protocol improvements—Amsterdam and Gloas—bringing together 18 core Ethereum Improvement Proposals alongside 7 supplementary ones. The upgrade introduces substantial modifications to block processing and data management.
Among the most notable adjustments is a dramatic expansion of the gas limit ceiling, which will jump from 60 million to 200 million. This enhancement will enable the network to handle significantly more transactions and execute more complex computational tasks within each block.
Speaking at Tuesday’s OKX NOW conference, Ethereum co-founder Vitalik Buterin predicted that decentralized applications will increasingly integrate artificial intelligence capabilities over the coming two years, with automated systems managing a growing share of user-facing interactions.

Market Volatility and Forced Liquidations
The sudden price decline sparked a cascade of forced liquidations throughout cryptocurrency markets. Market intelligence account Watcher.Guru reported that as ETH breached the $2,600 support level, approximately $400 million in leveraged long positions were forcibly closed within a mere 20-minute timeframe.
According to Coinglass tracking data, Ethereum positions worth $15.3 million were liquidated in the past 24 hours, with long positions accounting for $10.5 million of that total. Despite the downturn, ETH maintains its position above the 20-, 50-, and 100-day moving averages on daily charts, suggesting persistent buying interest despite recent weakness.
Key resistance zones are established near $2,781, with additional barriers at $3,075 and $3,260. Critical support rests at the 20-day moving average around $2,656, followed by levels at $2,631, $2,558, and the 50-day moving average at $2,500.
Institutional Withdrawals and Blockchain Metrics
Spot Ethereum exchange-traded funds have now registered six consecutive trading sessions of net withdrawals. Institutional and retail investors have extracted $207 million from these investment vehicles over five days, marking the longest sustained outflow period since June.
These redemptions follow ETH’s appreciation from $2,400 to $2,800 during late September. The withdrawal pattern indicates that some investors who entered positions at lower levels are now realizing gains.
Nevertheless, Ethereum’s Market Value to Realized Value (MVRV) Ratio has risen from 1.4% to 3.5% during this same window. This on-chain indicator, which measures the aggregate profit or loss position of all ETH holders relative to their acquisition costs, continues to show positive sentiment.
Market observers have drawn parallels between current price behavior and the April-May 2025 period, when ETH established a local bottom around $1,400 before surging to record highs following the Pectra upgrade implementation. They suggest a comparable trajectory could materialize if support at $2,400 remains intact.
Ethereum’s Relative Strength Index currently registers above the neutral 50 level, indicating bullish momentum that could facilitate a push toward $3,400 if buying pressure resurfaces. As of 06:37 UTC on October 7, ETH was trading at $2,617.71, representing a 2.98% decline over the previous 24 hours.
Get 3 Free Stock Ebooks
Discover top-performing stocks in AI, Crypto, and Technology with expert analysis.
- Top 10 AI Stocks - Leading AI companies
- Top 10 Crypto Stocks - Blockchain leaders
- Top 10 Tech Stocks - Tech giants


