



Quick Overview
- ETH hovers around $1,875 after multiple rejections at the $1,900 resistance zone
- The 14-day RSI stands at 49.72, indicating neutral momentum with slight weakness
- Open interest fell to May lows at 13.3 million ETH before seeing a modest rebound
- Spot Ethereum ETFs in the US attracted $245 million during five straight weeks of positive flows
- Critical support level sits at $1,850; losing this could trigger a decline toward $1,700
Ethereum continues to hover near $1,875 following repeated rejections at the $1,900 threshold. The asset briefly spiked to $1,920 during the week before retreating into its established trading corridor.
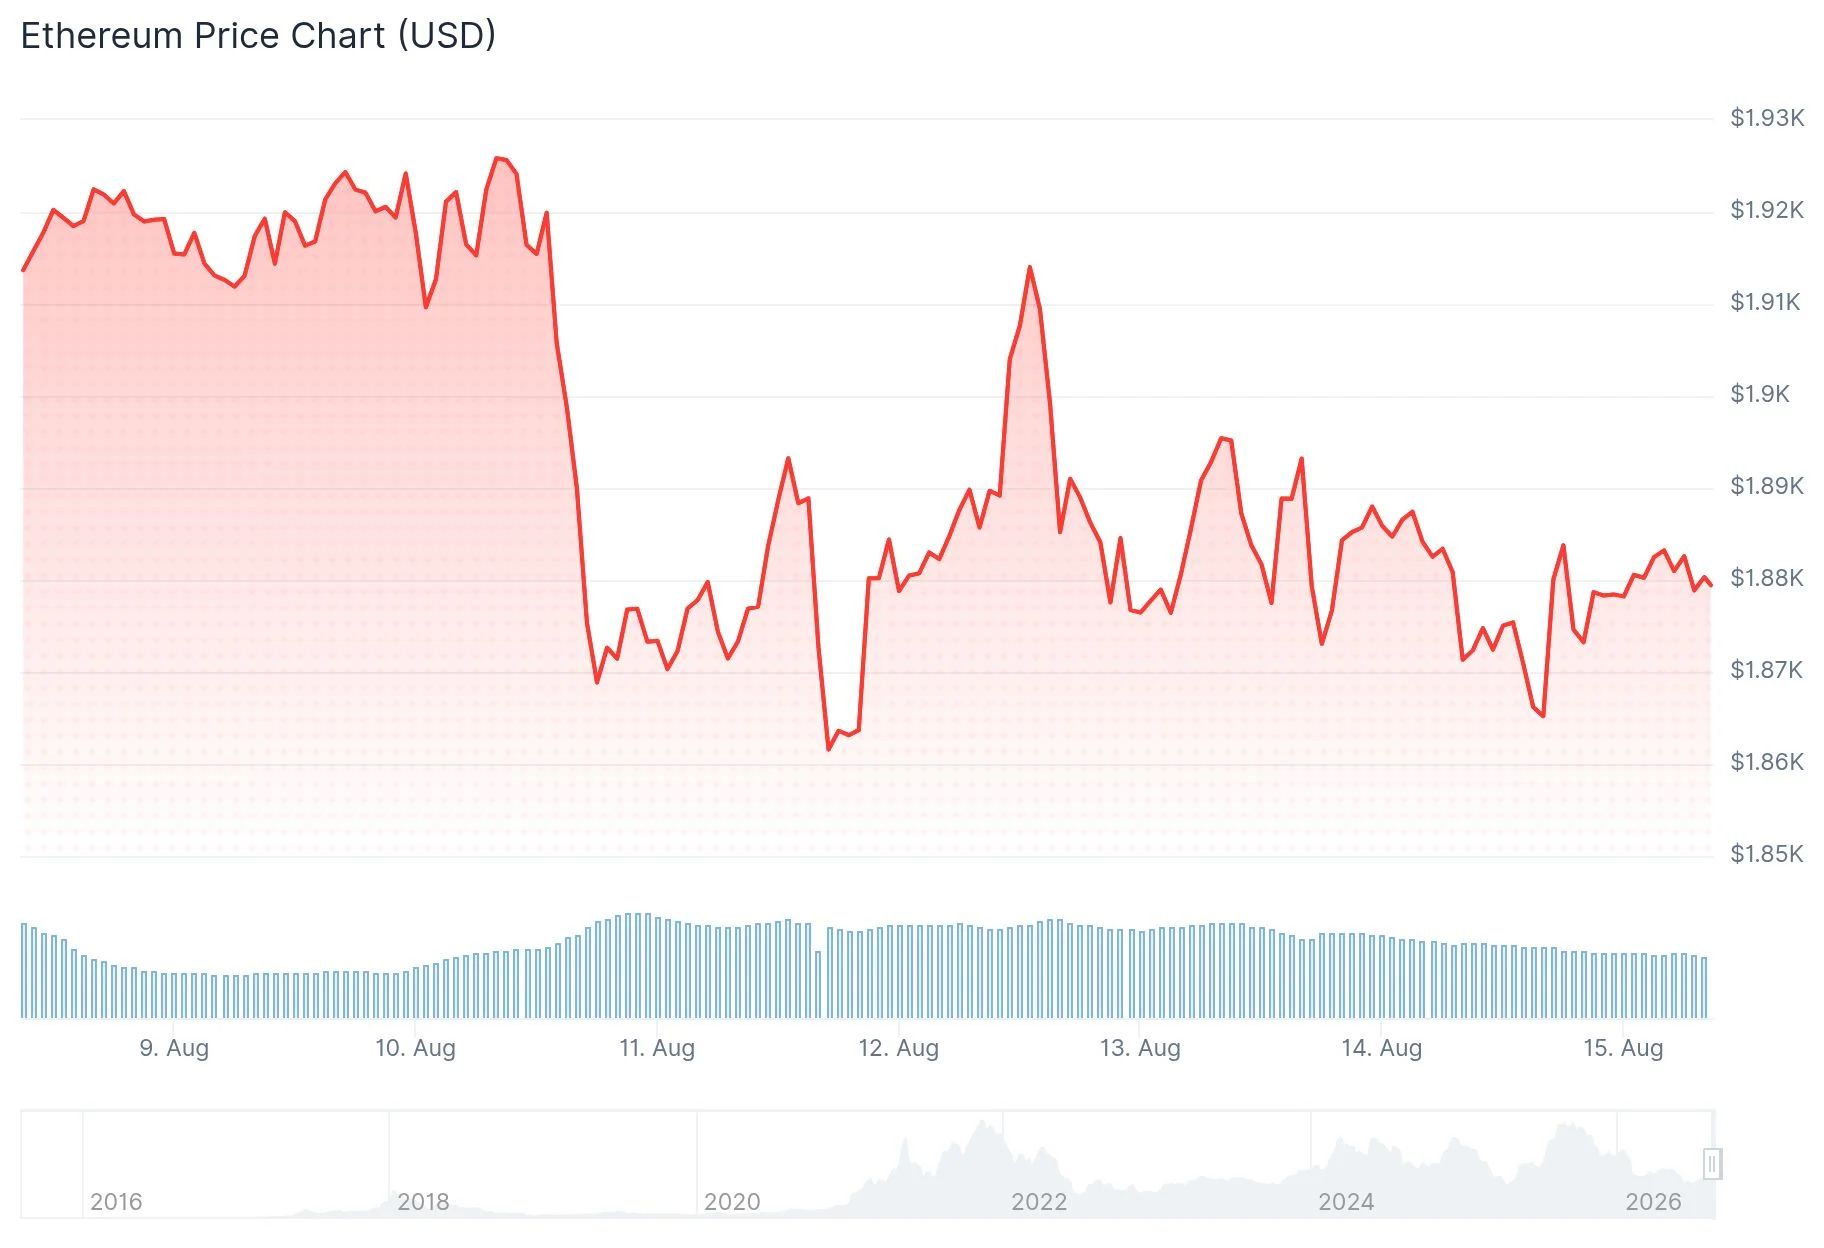
Bulls have successfully protected the $1,850 support level, yet each recovery attempt has met resistance between $1,900 and $1,920. Throughout most of August, ETH has remained trapped within this compressed price range.
The daily chart reveals ETH trading beneath both its 20-day moving average at $1,881 and 50-day moving average at $1,893. These technical indicators now serve as overhead resistance precisely where recent upward attempts have stalled.
With the 14-day RSI positioned at 49.72—marginally under the 50 midpoint—momentum appears balanced but tilted bearish. Meanwhile, Chaikin Money Flow registers at -0.01, suggesting equilibrium between buyers and sellers with a fractional advantage to the downside.
Strong ETF Demand Fails to Spark Price Momentum
Between August 3 and August 7, US-based spot Ethereum ETFs accumulated $245 million in net inflows, extending their positive streak to five consecutive weeks. BlackRock’s ETHA dominated with $203 million in fresh capital, while Fidelity’s FETH contributed $24.2 million. Conversely, Grayscale’s ETHE experienced $4.8 million in withdrawals during this timeframe.

This persistent institutional accumulation has yet to catalyze a breakout from the $1,900–$1,950 resistance corridor.
Market analyst Daan Crypto Trades highlighted that ETH remains confined between $1,750 and $2,100—price levels that have functioned as pivotal support and resistance zones throughout the past two years. He identified $2,100 as the critical threshold worth monitoring, noting that while the recovery above $1,750 signaled initial strength, $2,100 represents the genuine test of bullish conviction.
Trader Ted Pillows emphasized $1,850 as a “critical support level” that must hold for ETH to maintain its recent recovery. He outlined upside targets beginning at $1,955, extending to $2,050, and ultimately $2,190. Should $1,850 fail, he warned of potential downside movement toward $1,700.
Tight Liquidation Zones Present on Both Ends
According to the CoinGlass one-week liquidation heatmap, significant upside liquidity concentrations appear near $1,940–$1,950, accompanied by a notable cluster around $1,925. Conversely, downside liquidity pockets are positioned near $1,855–$1,860 and $1,835–$1,845.
Ethereum open interest contracted to 13.3 million ETH on Thursday—the lowest reading since early May—before bouncing back to 13.9 million on Friday. Funding rates maintained a positive reading near 0.0044%, indicating a modest long-oriented sentiment despite diminished overall market engagement.
Over the trailing 24-hour period, ETH has witnessed $26.9 million in total liquidations, with long positions accounting for $21.1 million of that figure.
Get 3 Free Stock Ebooks
Discover top-performing stocks in AI, Crypto, and Technology with expert analysis.
- Top 10 AI Stocks - Leading AI companies
- Top 10 Crypto Stocks - Blockchain leaders
- Top 10 Tech Stocks - Tech giants


