
 Surges 14% Following BitMine’s Strategic Dip Purchase — Price Outlook")
Key Highlights
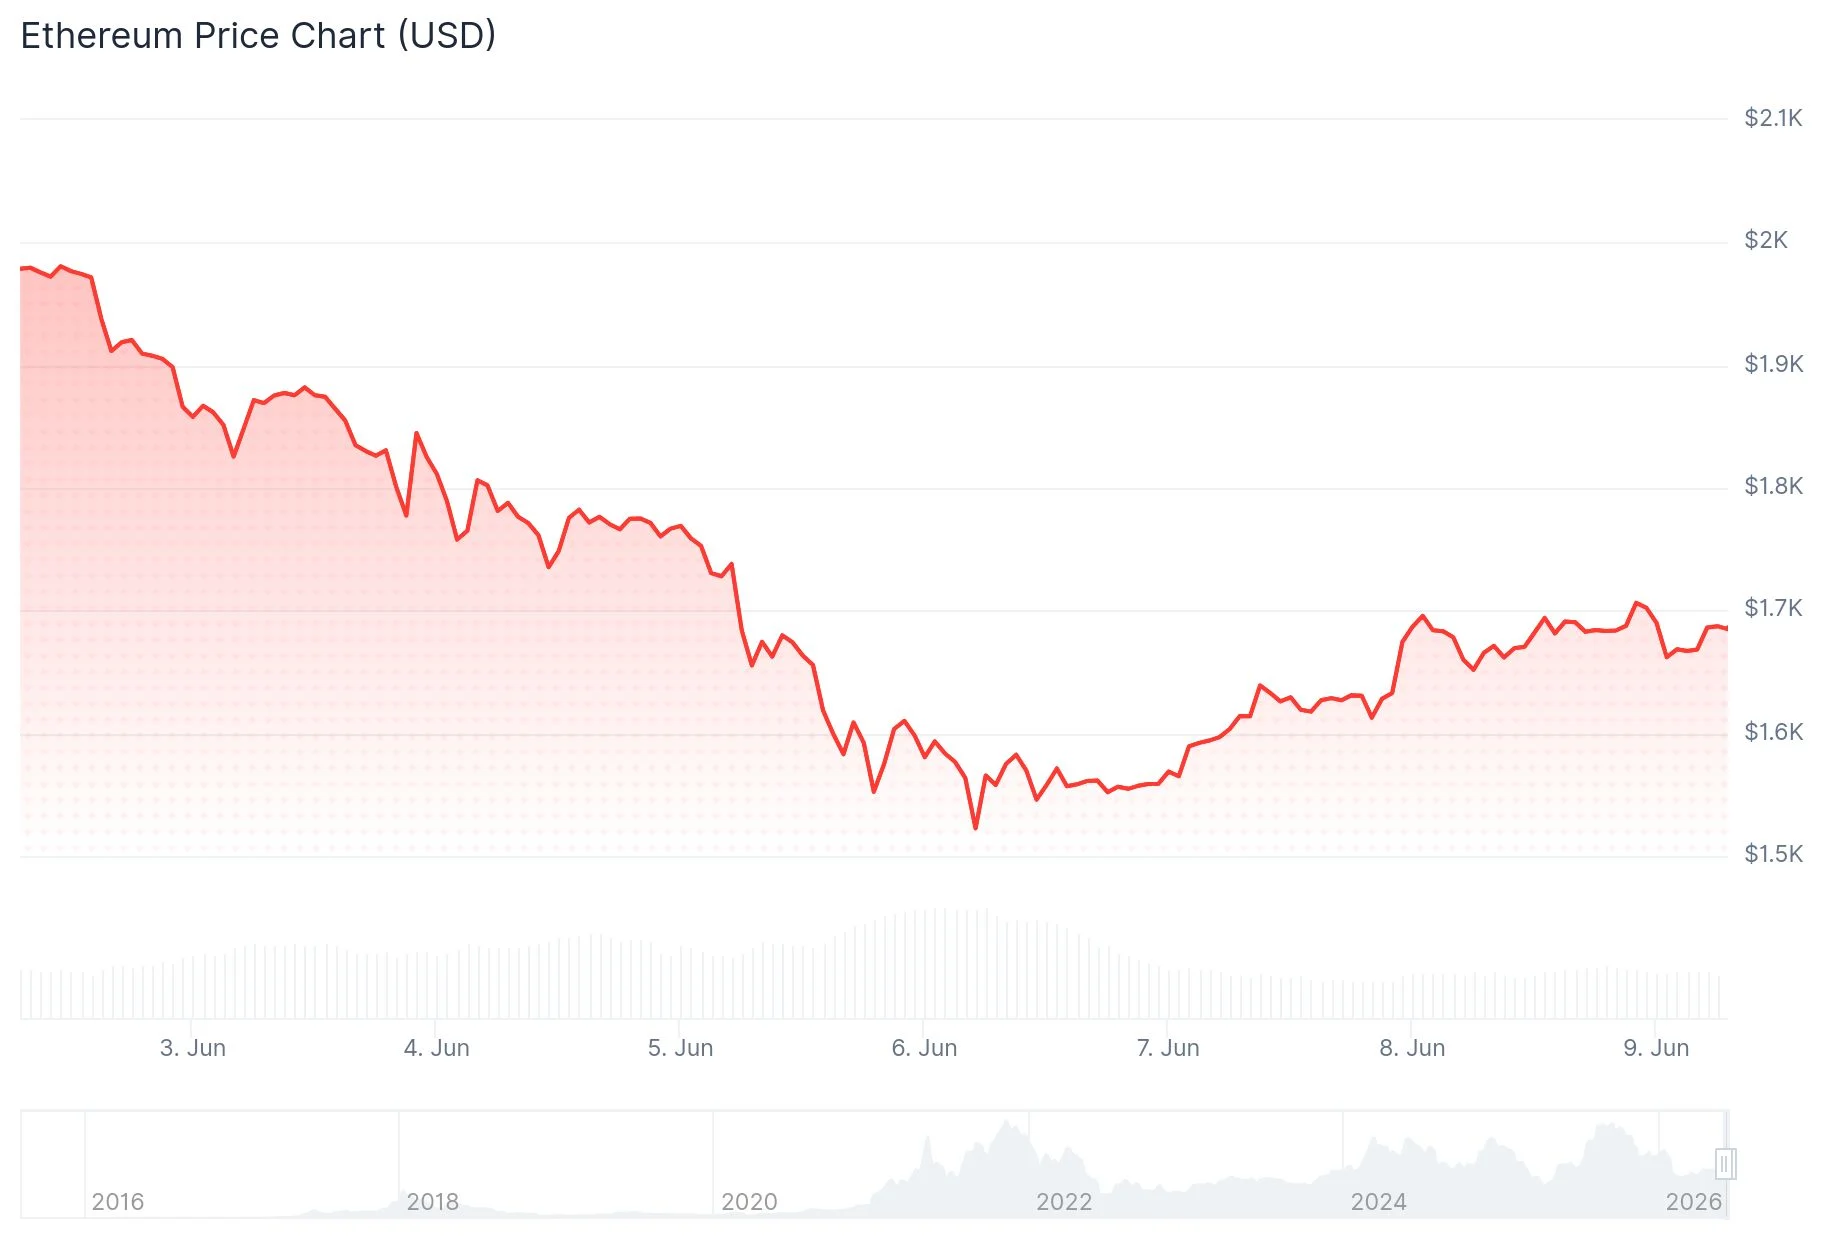
- ETH currently trades around $1,691, posting a 1.4% gain over the past 24 hours despite lingering in a prolonged downtrend
- BitMine Immersion Technologies acquired 126,971 ETH during last week’s downturn, pushing total holdings to 5.54 million tokens valued at approximately $9 billion
- Technical indicators including MACD and Aroon continue to flash bearish signals with selling pressure dominant
- Crypto analyst Ali Charts identifies ETH trading beneath the 0.8 MVRV band as a historically favorable accumulation opportunity
- Closing below $1,500 on a weekly basis could trigger further downside toward $1,000
Ethereum has mounted a recovery to the $1,691 level following last week’s brief decline to $1,505. The digital asset has gained approximately 1.4% during the past 24-hour period, with price action confined to a range spanning $1,656 to $1,713.
Despite this recent uptick, the rebound hasn’t managed to disrupt the prevailing downtrend established since April. ETH continues trading beneath critical resistance zones that must be conquered for any meaningful trend reversal.
The immediate resistance zone lies between $1,700 and $1,715. Successfully closing above this threshold on a daily timeframe could pave the way toward $1,875, followed by the $1,900 to $2,000 region. Sustained trading above these price points would be necessary before confirming any genuine trend transformation.
Market analyst Ash Crypto highlighted parallels between current price behavior and Ethereum’s June 2022 collapse, when ETH plummeted to $880 before staging a recovery. He observed that ETH has declined roughly 68% from its August 2025 peak near $4,953.
“If ETH maintains the $1,500 level, this scenario could mirror June 2022 precisely,” Ash Crypto stated. He cautioned that a weekly candle close beneath $1,500 might expose the next substantial support around $1,000.
Accumulation Zone Identified by Ali Charts
Cryptocurrency analyst Ali Charts shared on X that Ethereum trading underneath the 0.8 MVRV pricing band represents a “high-probability long-term accumulation zone,” encouraging followers to “Buy the dip.” He additionally highlighted a TD Sequential buy signal that appeared two days prior, suggesting potential seller exhaustion, although this doesn’t necessarily confirm an immediate reversal.

Blockchain metrics reinforce the current market strain. Merely 11% of Ethereum’s circulating supply currently maintains a threefold profit margin, marking the lowest percentage recorded since February 2017.
BitMine’s Substantial 126,000+ ETH Acquisition
BitMine Immersion Technologies executed its most significant weekly Ethereum acquisition of 2026, purchasing 126,971 tokens throughout the recent price decline. This strategic buy elevates the company’s aggregate holdings to 5,543,872 ETH, representing approximately 4.59% of Ethereum’s estimated circulating supply.
The firm’s ETH position carries an estimated value of $9.04 billion. Chairman Tom Lee disclosed that projected annualized staking revenue has climbed to $230 million, with 4.7 million ETH presently staked.
ETF activity presents a contrasting narrative. United States spot Ethereum ETFs experienced $540 million in outflows throughout May, followed by an additional $168 million departing during early June. Nevertheless, June 8 recorded $82.37 million in daily net inflows, elevating cumulative inflows to $11.28 billion with aggregate net assets reaching $9.36 billion.
The MACD indicator currently registers at -141.09, positioned below the signal line of -118.04. The Aroon Oscillator displays a reading of -78.57, validating continued seller dominance. Near-term support exists at $1,650, with subsequent levels at $1,580 and $1,505 beneath that threshold.
Get 3 Free Stock Ebooks
Discover top-performing stocks in AI, Crypto, and Technology with expert analysis.
- Top 10 AI Stocks - Leading AI companies
- Top 10 Crypto Stocks - Blockchain leaders
- Top 10 Tech Stocks - Tech giants

