


Key Highlights
- SOL has climbed 12% over the last 30 days, currently hovering around $77
- ETF inflows for Solana reached a two-week peak, with BSOL attracting $5.83M
- Returning dormant wallets on Solana DEXs exploded by 400% within seven days
- Critical resistance level identified at $78; breaking past $97.89 may unlock $120–$130 targets
- Moving average crossover pattern emerges, indicating potential bullish momentum
Solana has delivered a 12% gain over the past month, positioning itself as the second-strongest performer among the top five cryptocurrencies by market capitalization. Currently, SOL is changing hands near $77 with daily trading volume registering $1.61 billion.
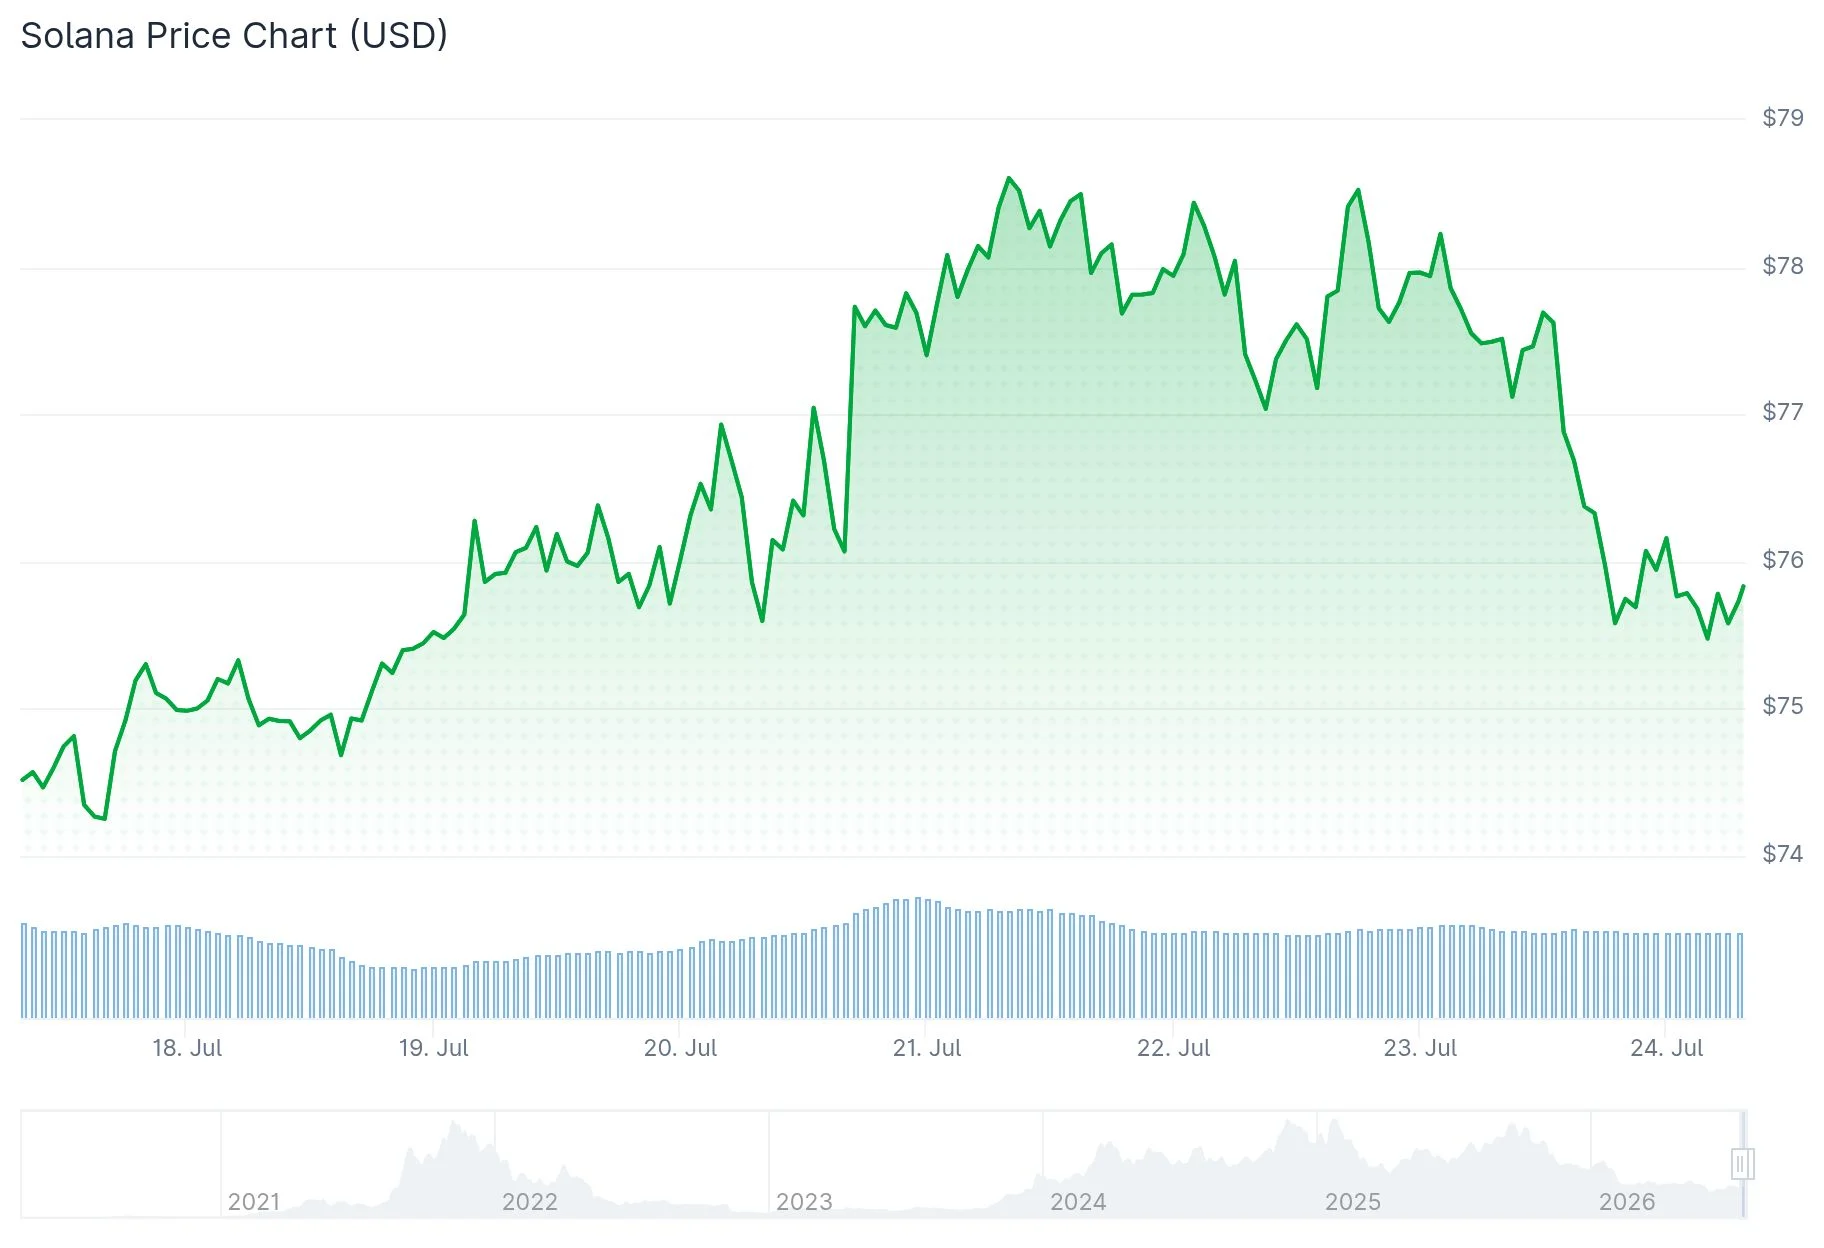
After four consecutive days of positive price action, trading volume has moderated from $2.2 billion down to $1.7 billion. Market participants appear to be consolidating recent gains.
Investment flows into Solana ETF products shifted into positive territory this week, with $7.2 million in net inflows. The Bitwise Solana Staking ETF (BSOL) dominated activity, capturing $5.83 million on July 21 alone—marking the strongest single-day performance in the past fortnight.
The momentum reversed slightly the next day, with $1.27 million in outflows—approximately 25% of the previous day’s gains. For July overall, net inflows have reached nearly $12 million, a significant improvement from June’s $786,000 net outflow.
However, July’s inflow rate represents an 86% decline from May’s impressive $115 million, which occurred when SOL was trading around the $80 mark.

Dormant Wallet Activity Explodes
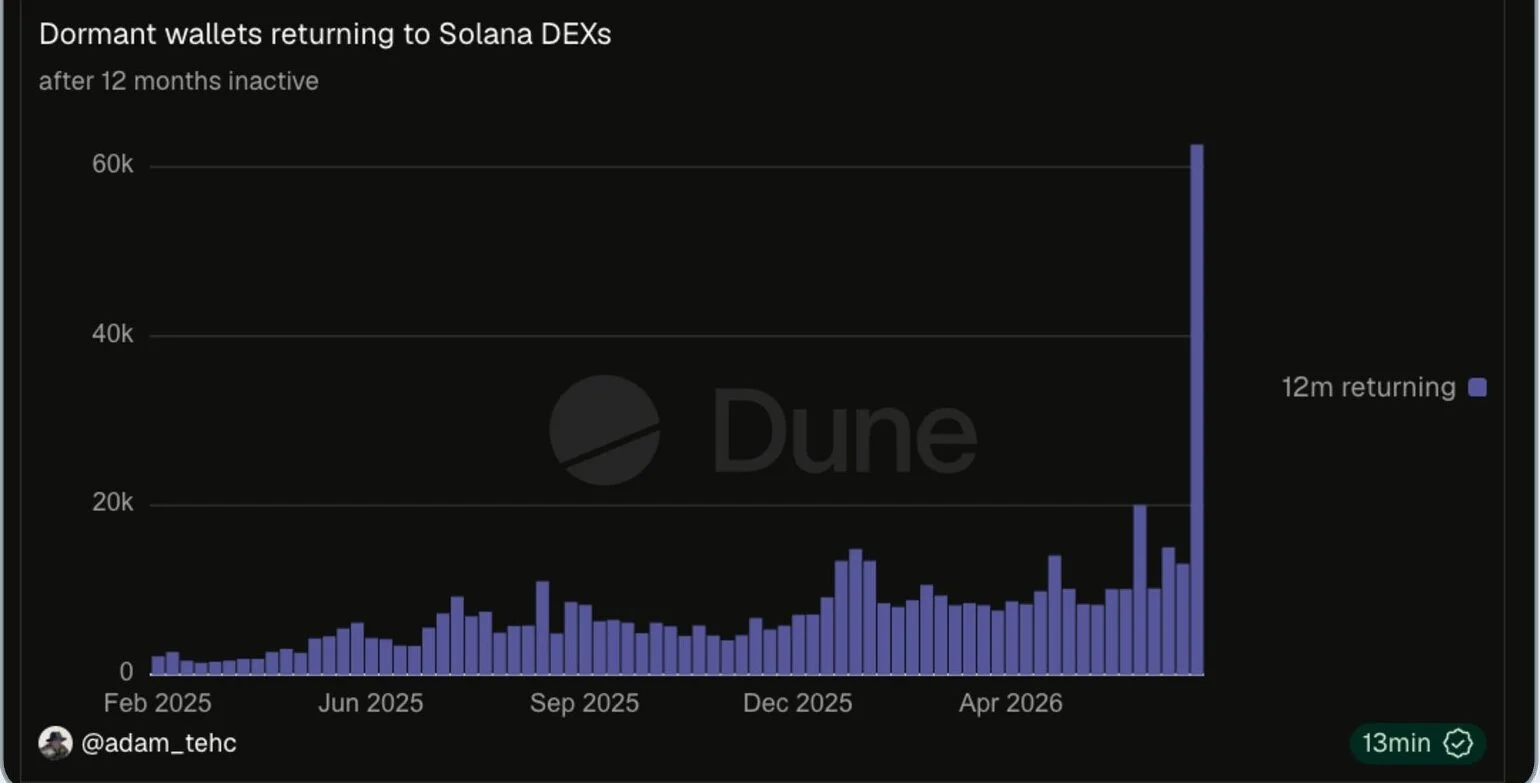
The number of dormant wallets reactivating on Solana decentralized exchanges surged to 62,000 last week, compared to fewer than 20,000 the previous week. This 400% spike represents the highest returning user count recorded in more than 12 months.
According to DeFi Llama, Solana’s stablecoin supply reached a new record high of $17 billion. Meanwhile, application fees on the network continue to languish at two-year lows.
Cryptocurrency analyst Michaël van de Poppe shared on X that SOL is “holding the range low” and believes it’s “just a matter of time” before the asset pushes toward $120. Van de Poppe has identified the $75 level as a crucial support zone.
Critical Resistance Zones Ahead
A bullish moving average crossover has materialized, with the faster-moving average climbing above its slower counterpart—a technical pattern that traders monitor for potential trend reversals. Additionally, the RSI indicator is positioned above neutral territory, signaling growing buying interest.
For SOL to confirm a shift from bearish to bullish market structure, it must secure a close above $97.89. Until that threshold is breached, the technical outlook remains bearish.
Should Solana successfully breach the $78 resistance area, market analysts are targeting the $90–$95 zone next, which aligns with the current position of the 200-day EMA. A convincing break above $97 could catalyze a move toward the $120–$130 price range.
The Crypto Fear and Greed Index currently stands at 39, hovering near Neutral territory. More than 50% of analysts monitored by FedWatch anticipate a 25 basis point Federal Reserve rate increase by September, which may cap short-term upside potential for alternative cryptocurrencies.
Solana and Hyperliquid ETF products currently represent approximately 80% of all non-BTC/ETH ETF trading volume, with total assets under management for Solana ETFs nearing the $1 billion milestone.
Get 3 Free Stock Ebooks
Discover top-performing stocks in AI, Crypto, and Technology with expert analysis.
- Top 10 AI Stocks - Leading AI companies
- Top 10 Crypto Stocks - Blockchain leaders
- Top 10 Tech Stocks - Tech giants


