



Key Takeaways
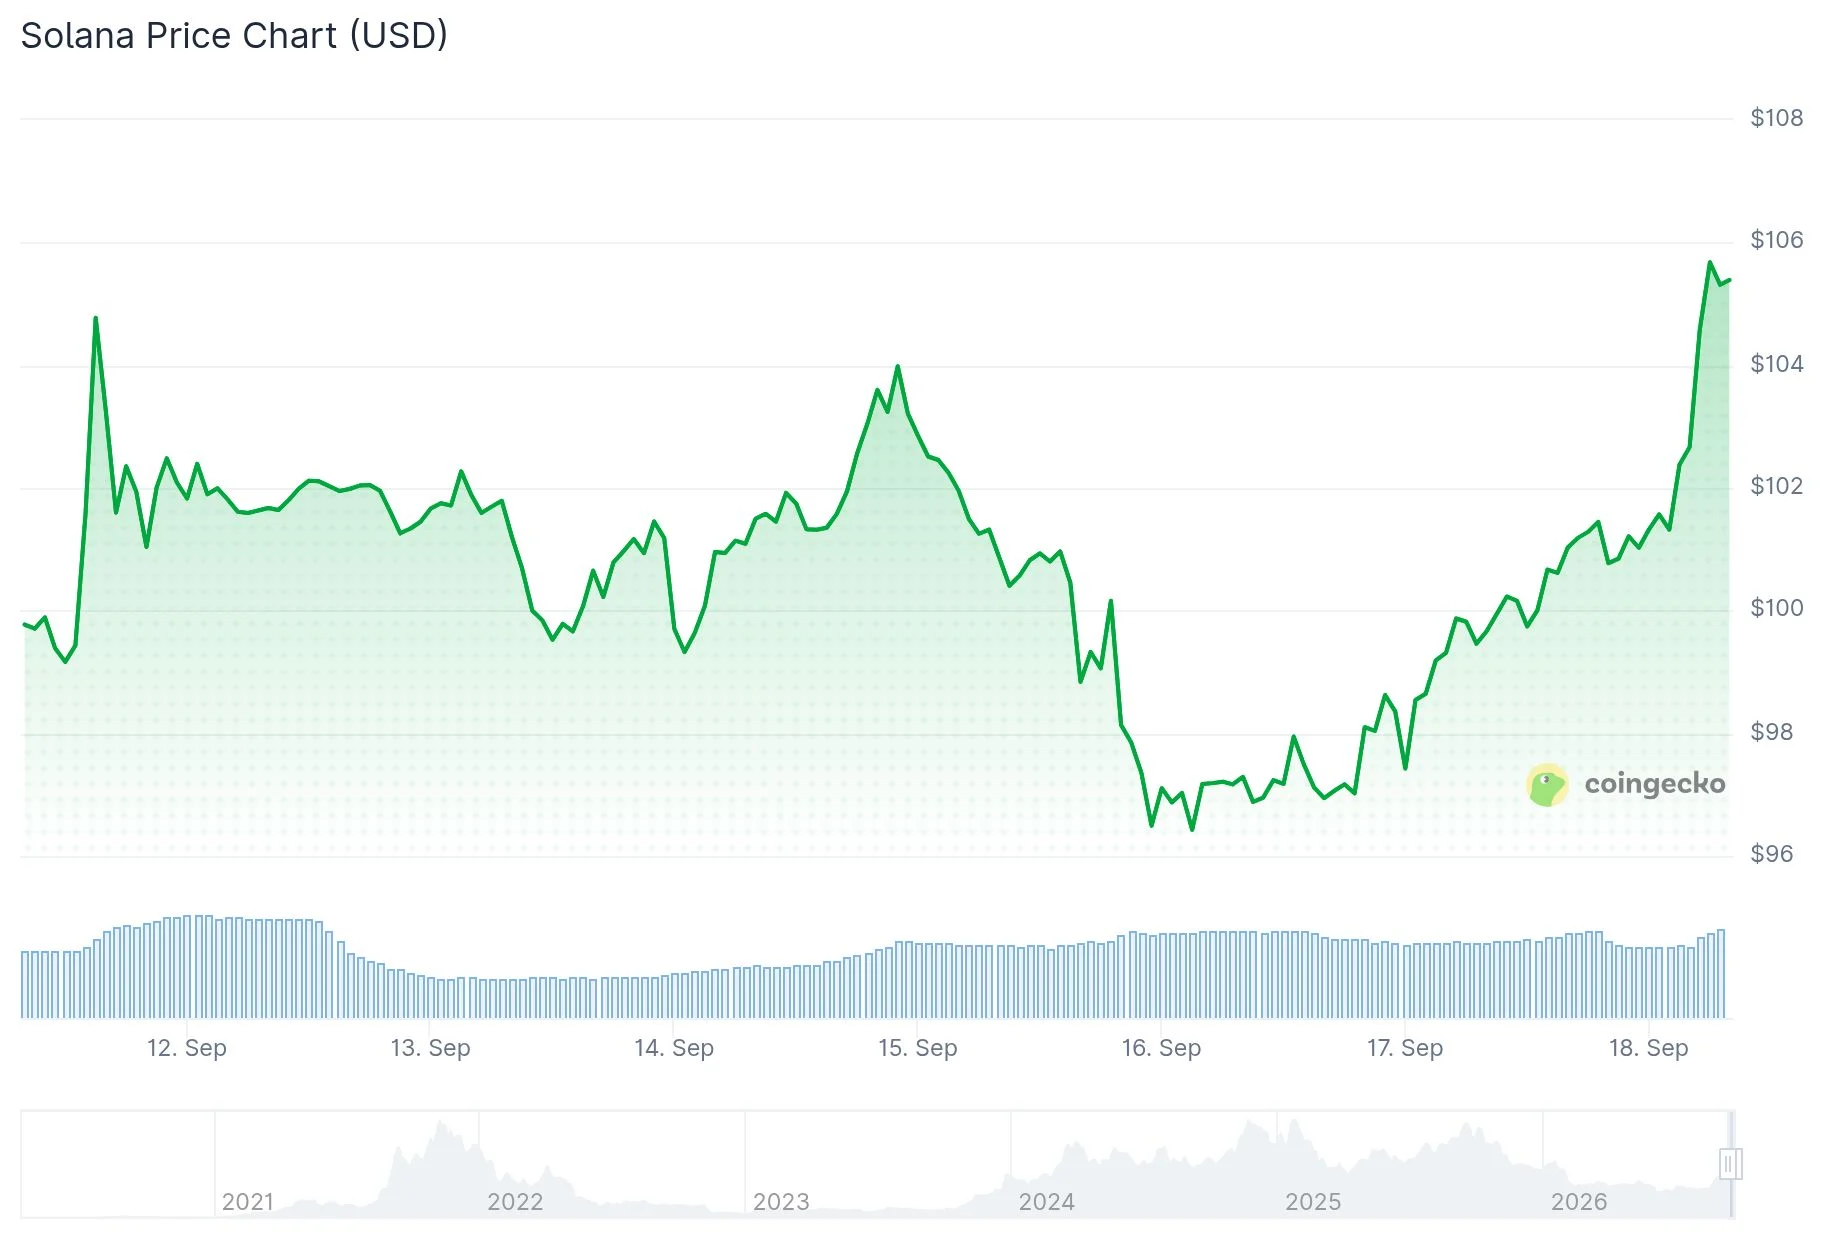
- Solana maintained trading activity between $101–$105, posting gains of approximately 4–5% over 24 hours
- Technical analyst Ali Charts has pinpointed $105 as the critical resistance threshold
- A decisive break above $105 may trigger a potential rally targeting $130
- Net inflows into Solana ETF products totaled $836,930 on September 16
- Weekly chart analysis reveals a possible SMA crossover that technical analysts view as a significant development
Solana maintained its position above the crucial $100 threshold on Wednesday following a roughly 5% surge over the preceding 24-hour period. As of press time, SOL was exchanging hands around $101.32, demonstrating stronger performance compared to the wider cryptocurrency landscape.
The aggregate cryptocurrency market capitalization climbed 2.13% to reach $2.63 trillion. Bitcoin hovered near the $76,000 level while Ethereum traded around $2,450 during this timeframe.
Technical analyst Ali Charts identified a bull flag pattern emerging on Solana’s four-hour timeframe. This formation materialized following an earlier upward momentum phase, subsequently transitioning into a narrowing consolidation pattern around the $101 region.
According to Ali Charts, $105 represents the pivotal threshold requiring attention. In a statement shared via X, the analyst explained: “A sustained close above it could confirm the bullish breakout and open the door to a rally toward $130.” The analyst cautioned that any advance beyond $105 lacking a solid close might constitute a false breakout scenario.

Technical indicators revealed SOL’s MACD line positioned at -0.10, trading above the signal line at -0.55, accompanied by a positive histogram reading of 0.44 suggesting strengthening momentum. The RSI registered 59.42, indicating increased buying pressure while remaining below overbought conditions.
ETF Activity and Trading Metrics
Exchange-traded fund products tracking Solana captured net inflows totaling $836,930 on September 16, based on data from SoSoValue. Bitwise’s BSOL product topped the list with $2.69 million in inflows, contrasting with Grayscale’s GSOL which experienced $1.85 million in outflows.
Combined net assets across the seven available Solana ETF offerings reached $1.38 billion, representing 2.38% of SOL’s overall market capitalization. Trading volume across these investment vehicles totaled $51.57 million daily, with BSOL maintaining the largest fund position at $945.76 million.
In a separate observation, Ali Charts provided a broader perspective on Solana’s blockchain metrics, highlighting that over 40 million SOL tokens have changed hands near the $100 price point, establishing what the analyst characterized as substantial support infrastructure. The weekly timeframe, per Ali Charts, displays a cup-and-handle configuration with a neckline positioned around $360.
Moving Average Analysis and Tokenization Developments
Examining the weekly chart, analyst Trader Tardigrade called attention to an impending crossover between Solana’s 100-period and 150-period simple moving averages. The analyst referenced historical occurrences where comparable crossovers preceded significant price appreciation. Tardigrade proposed a long-range technical objective of $1,000 per SOL, though this represents an individual trader’s forecast rather than widespread market expectations.
Developments in the tokenization sector also involved Solana. Solflare integrated more than 750 tokenized equity assets into its xStocks platform, encompassing shares from companies including Nike, Disney, and Airbnb.
On September 17, the Securities and Exchange Commission unveiled a five-year conditional exemption designed to facilitate certain blockchain-based trading of tokenized equities and securities, relaxing specific conventional exchange and dealer obligations.
At the time of the latest assessment, SOL was exchanging near $100.14 with 24-hour trading volume reaching $6.27 billion and a market capitalization hovering around $59 billion.
Get 3 Free Stock Ebooks
Discover top-performing stocks in AI, Crypto, and Technology with expert analysis.
- Top 10 AI Stocks - Leading AI companies
- Top 10 Crypto Stocks - Blockchain leaders
- Top 10 Tech Stocks - Tech giants


