
 Eyes Breakout Rally as Institutional Money Floods In and RWA Assets Surge")
Key Takeaways
- Solana currently trades at $85.95, maintaining position above its 20-day EMA at $85.31, while facing resistance at the 50-day EMA of $87.08 throughout March.
- A decisive break above a multi-month descending trendline has occurred on the daily timeframe, with price now retesting the breakout area that may validate a bullish reversal.
- Weekly timeframe analysis indicates $120–$125 represents the next significant resistance zone should SOL successfully breach its near-term downtrend.
- Real-world asset tokenization on Solana expanded from $170M to $2B over twelve months, supported by 80–100M active wallets and $17B in stablecoin liquidity.
- Cumulative inflows into SOL spot ETFs surpassed $1B for the first time, with aggregate net assets reaching $887.92M.
As of April 23, Solana is valued at $85.95, registering a 1.10% decline for the session. The cryptocurrency has maintained support just above its 20-day exponential moving average positioned at $85.31, a level that has provided a floor throughout the past seven days.
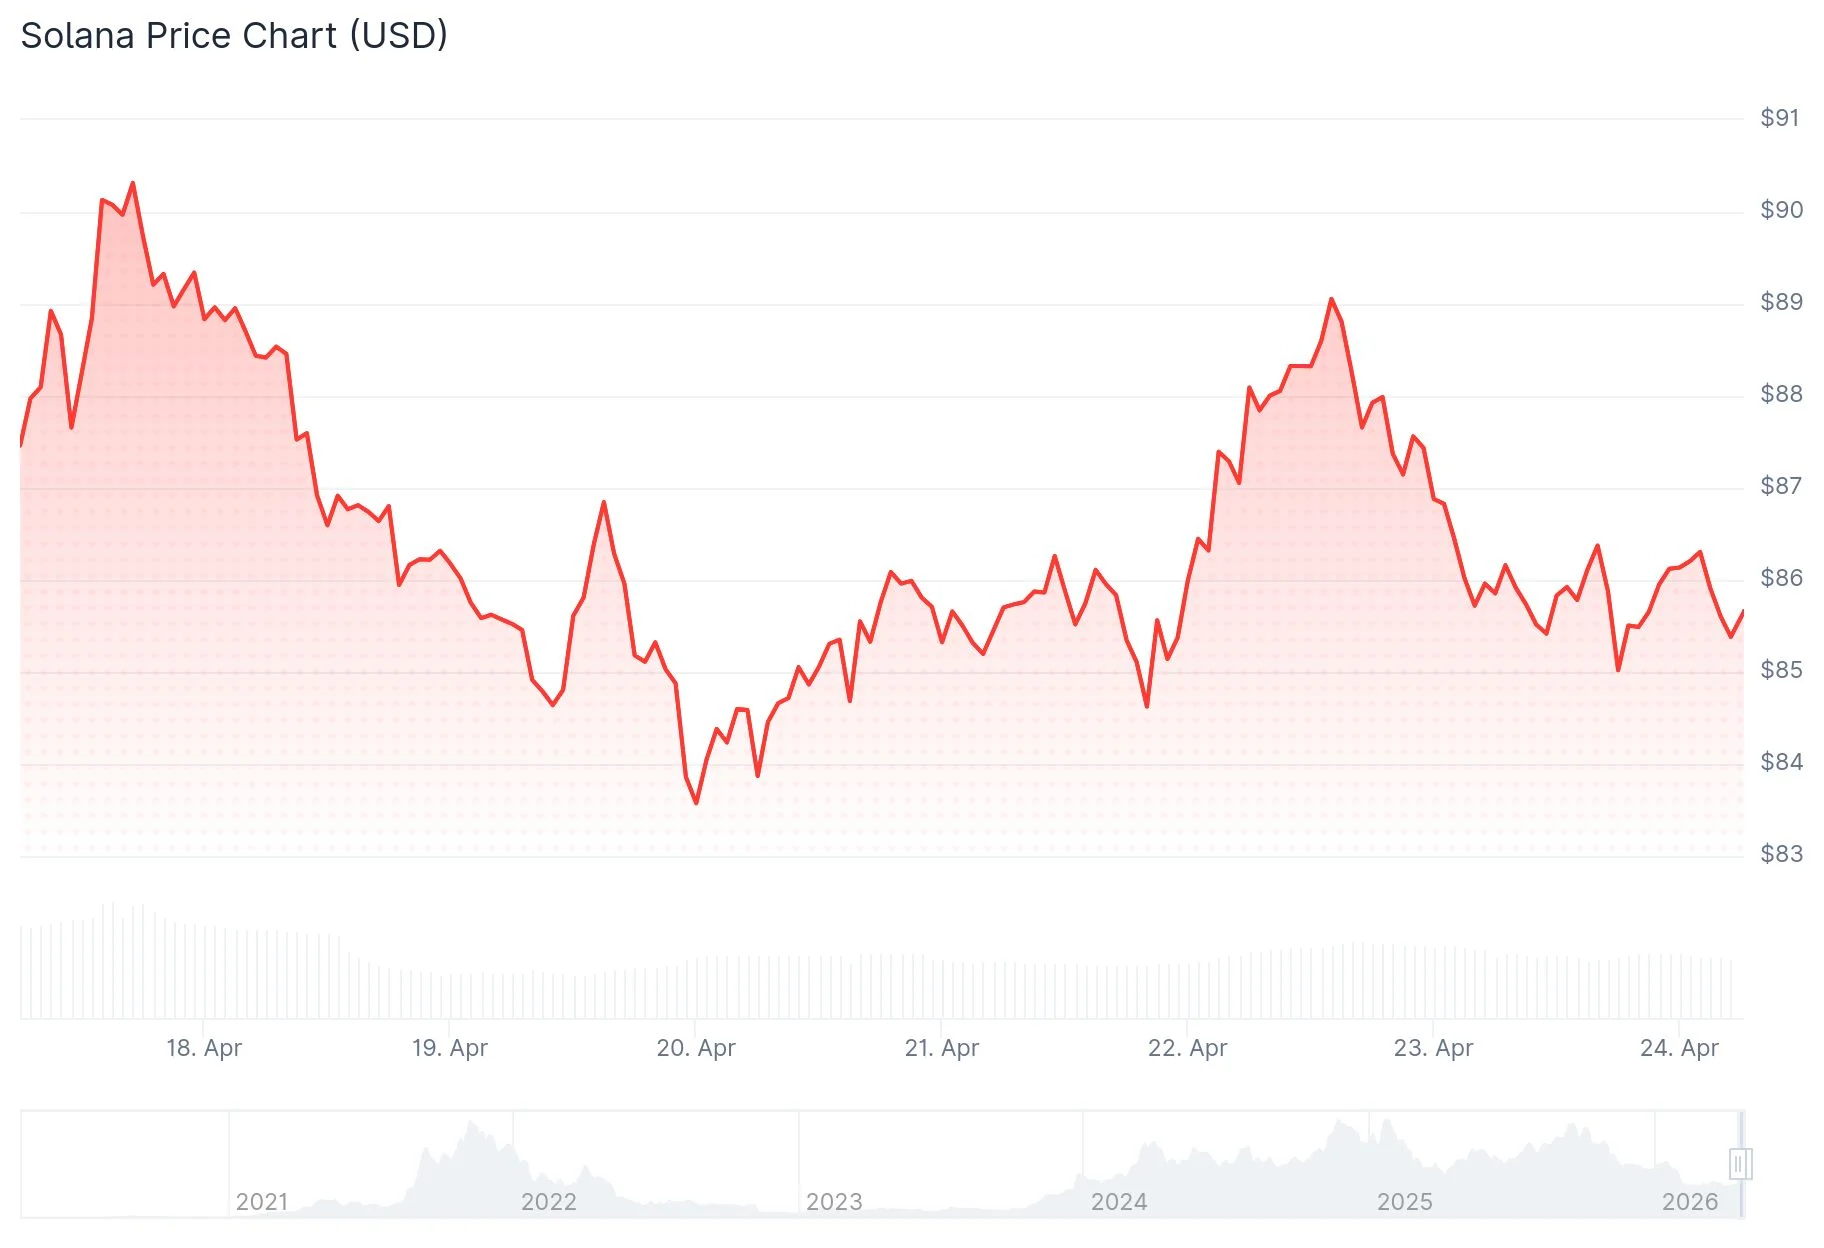
Resistance continues to emerge at the 50-day EMA, currently sitting at $87.08. Since March began, every attempt to close above this threshold on a daily basis has been turned back. The upper boundary of the Bollinger Bands rests at $89.43, while the 100-day EMA extends further to $96.63.
Should the 20-day EMA fail to hold on a closing basis, the middle Bollinger Band at $84.63 becomes the next support target. Beneath that level, traders are eyeing the lower Bollinger Band at $79.84, with the February low around $67 representing deeper support.
Technical chart analysis reveals SOL has pierced above a descending trendline that constrained upside movement throughout late 2025 and into early 2026. Technical commentary from CryptoCurb on X highlights the breakthrough occurred after multiple rejection attempts, including during the Binance flash crash incident and Iran conflict escalation.
[[EMBED_0]]Price action is currently consolidating near the breakout region instead of reversing below the trendline. This represents a meaningful structural shift. However, the bullish case strengthens only if demand emerges at this level and the previously broken trendline transitions into a support floor.

Institutional Capital Accelerates
Solana ecosystem executive Nick Ducoff revealed that real-world asset tokenization on the network expanded from $170M to $2B within a twelve-month period—representing approximately 12x growth. Institutional participants have highlighted three primary drivers: network stability and uptime, a distribution network of 80 to 100 million active wallets, and $17B in stablecoin infrastructure already deployed on-chain.
[[EMBED_1]]Cumulative inflows into SOL spot exchange-traded funds have eclipsed $1B for the first time. Total net assets under management currently stand at $887.92M, equivalent to 1.77% of Solana’s overall market capitalization. Last week witnessed weekly ETF inflows of $35.17M. While April 22 recorded no daily inflows, the preceding three trading sessions collectively brought in $31.32M.
Weekly Timeframe Suggests $120–$125 Target
Analysis of the weekly chart from Rendoshi AI on X displays SOL challenging a falling resistance trendline after defending support in the $75–$80 range. The relative strength index has recovered from near-oversold territory, suggesting improving momentum conditions, though this alone doesn’t guarantee a breakout confirmation.
Should SOL successfully break and maintain levels above the weekly downtrend resistance, the subsequent major resistance zone emerges at $120 to $125. A rejection at current levels would likely result in continued range-bound trading above the $75–$80 support base without establishing a definitive recovery trajectory.
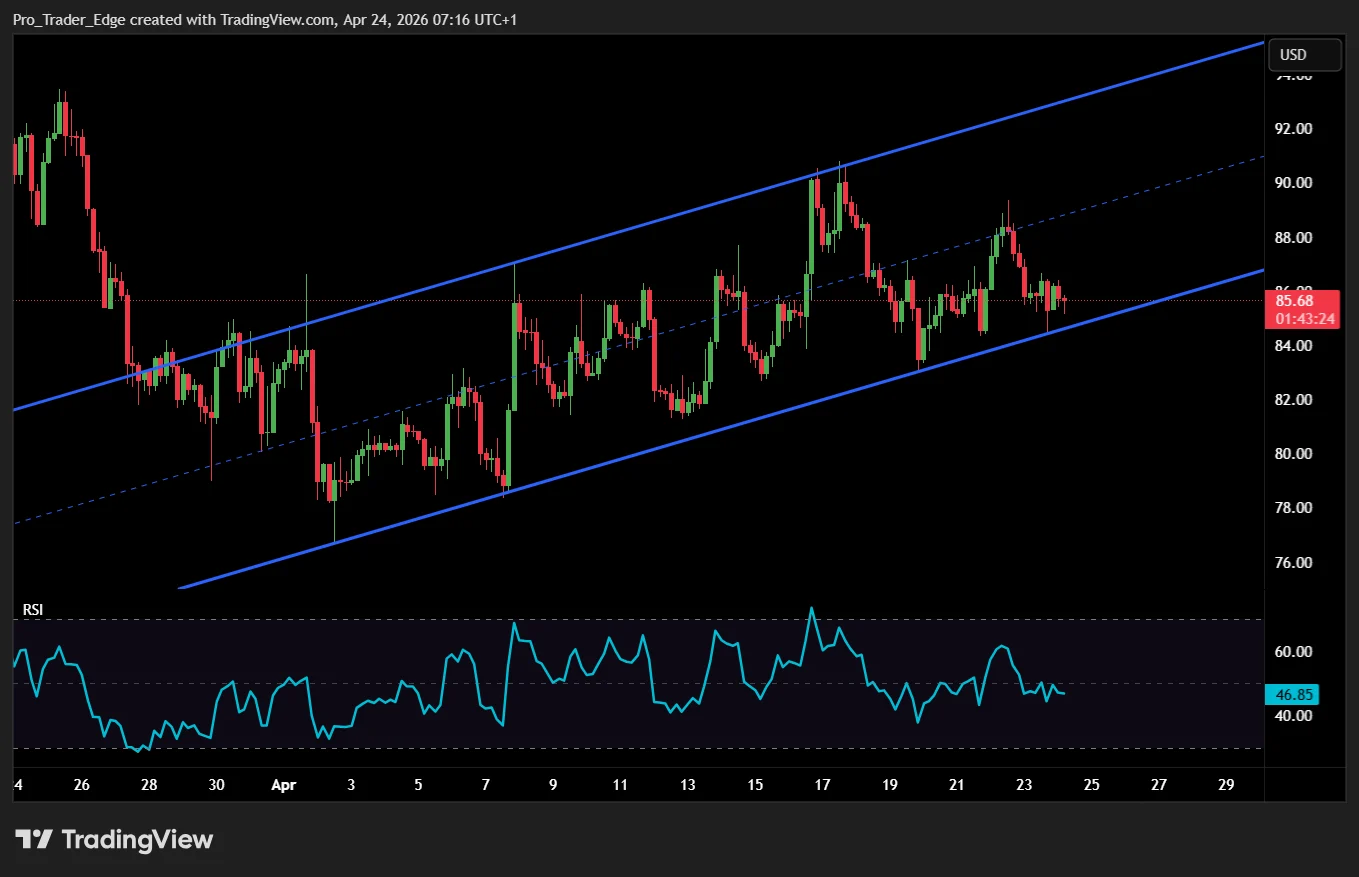
Examining the 2-hour chart, Solana is moving within an ascending channel formation that initiated at the April 2 low around $78. The RSI indicator displays a fresh bullish divergence signal at the recent low near $83—a pattern identical to formations that preceded previous bounces. The MACD histogram remains in negative territory at -0.25, indicating momentum confirmation has not yet materialized.
The lower boundary of the 2-hour ascending channel at $83–$84 converges with the daily 20-day EMA, establishing this zone as the critical support region to monitor heading into April 24.
Get 3 Free Stock Ebooks
Discover top-performing stocks in AI, Crypto, and Technology with expert analysis.
- Top 10 AI Stocks - Leading AI companies
- Top 10 Crypto Stocks - Blockchain leaders
- Top 10 Tech Stocks - Tech giants

