


Key Takeaways
- SOL has rallied approximately 30% from its June bottom of $60.13, currently hovering around $78
- The token is now positioned above its 50-day EMA at $76.82, with critical resistance emerging at $81.50
- Futures trading volume has increased 15% to $6.90 billion, indicating growing retail participation
- The SuperTrend indicator has triggered its first buy signal since October 2025
- SBI Holdings has formed a strategic alliance with Solana to develop blockchain-based financial solutions in Japan
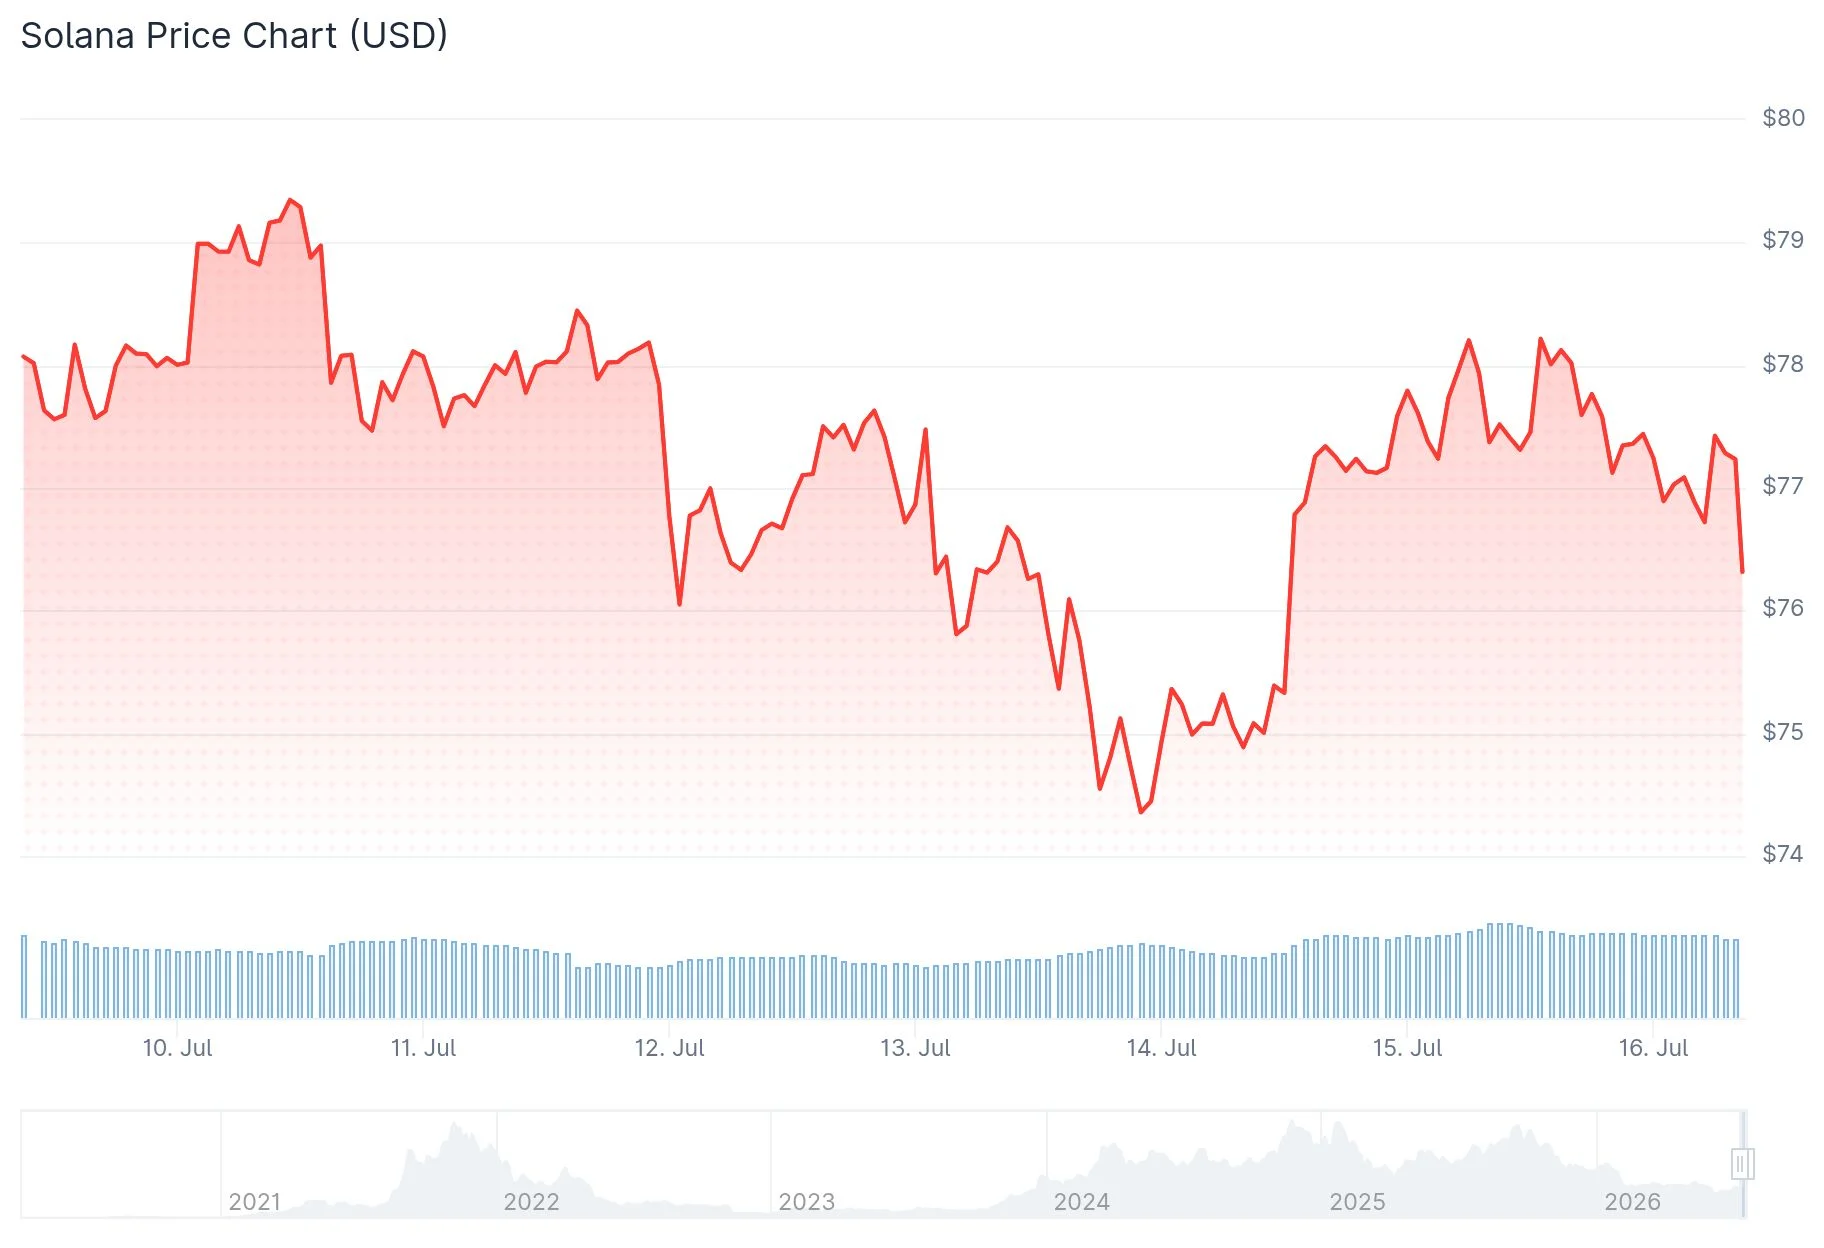
Solana has demonstrated impressive strength throughout the week, currently changing hands near $78 following an approximately 30% surge from its June cyclical bottom at $60.13. This upward movement has pushed SOL above its 50-day Exponential Moving Average (EMA), which currently stands at $76.82 and serves as immediate support.
Retail market participants seem to be the primary force behind this momentum. According to CoinGlass metrics, futures trading volume expanded by 15% to reach $6.90 billion over the last day, while Open Interest remained relatively stable at approximately $4.93 billion. The current funding rate of 0.0040% indicates a moderately bullish sentiment among derivatives traders.
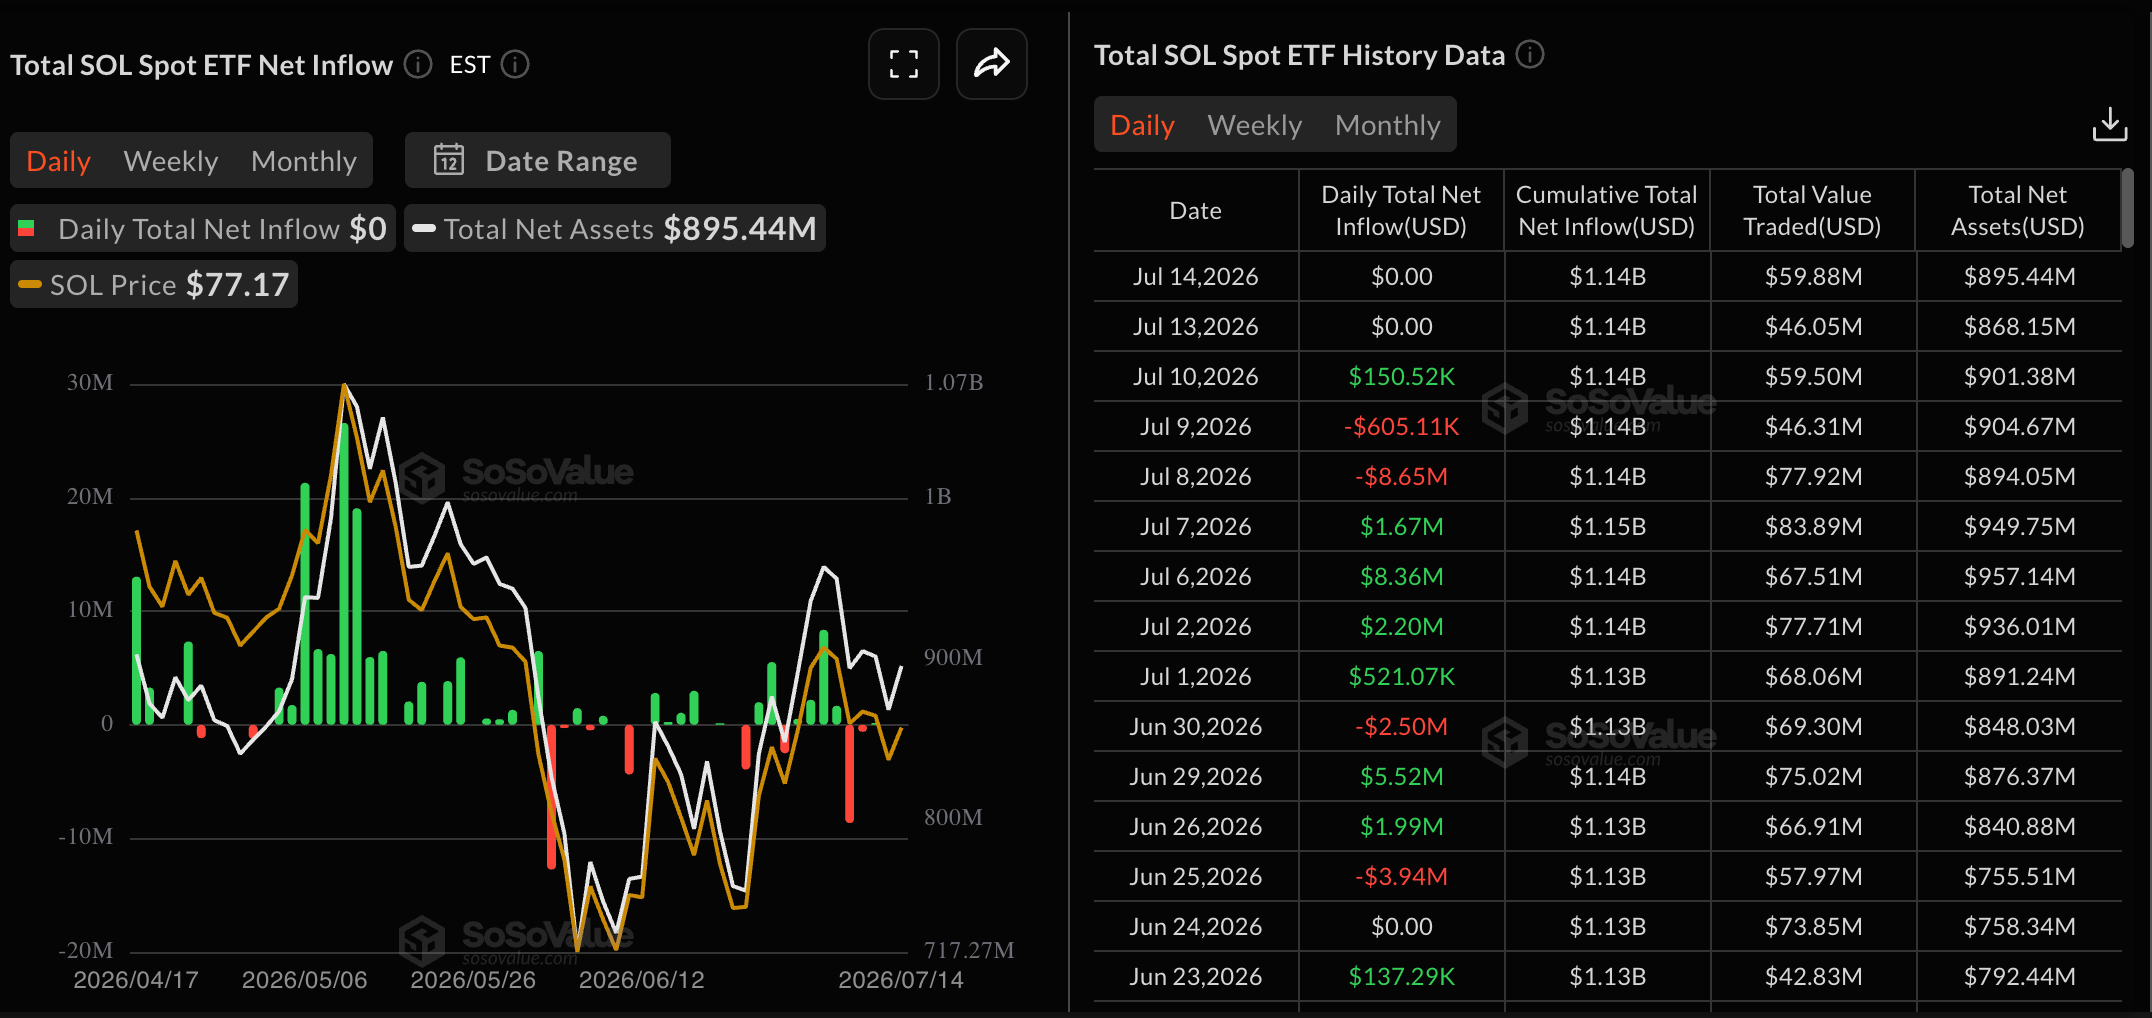
Meanwhile, institutional participation has remained subdued. Solana-focused exchange-traded funds have reported consecutive days of zero net inflows this week, indicating that traditional institutional capital remains cautious.
The critical price threshold to monitor is $81.50, where a descending trendline currently resides. A decisive daily candle close above this level would provide the first technical evidence that the prevailing downtrend is reversing. Should this breakout occur, subsequent resistance targets include $83.81, followed by the 78.6% Fibonacci retracement level at $88.56.
The $89–$92 Resistance Cluster
A more significant challenge awaits at higher levels. The $89 to $92 zone has repeatedly repelled price advances since March, establishing itself as a formidable barrier that must be conquered before a move toward $100 becomes feasible. The 200-day EMA, currently at $94.52, reinforces this resistance structure.

Market analyst Ali Martinez highlighted that the SuperTrend indicator has generated its first buy signal since October 2025. His technical assessment suggests potential price objectives near $96 and $121 if sustained buying pressure materializes.
Crypto strategist Michaël van de Poppe emphasized the importance of the current price level, stating on X that if SOL maintains these levels, a rally toward $120 over the coming months remains possible. He cited the recent market recovery as a catalyst for improved market conditions.
Strategic SBI Holdings Collaboration
Solana received additional positive news through a significant institutional partnership. SBI Holdings, one of Japan’s leading financial services companies, has announced a collaboration with the Solana network to develop blockchain-based financial infrastructure. This initiative encompasses stablecoins, tokenization of real-world assets, international settlement systems, and payment solutions for AI-driven agents.
Solana’s decentralized exchange ecosystem recorded approximately $4.15 billion in trading volume during a 24-hour period, positioning it ahead of rival blockchain networks on this measure.
On the bearish side, the $74–$75 zone represents critical support. Analyst BitGuru highlighted this area as a significant near-term floor on X. A breakdown below this range could trigger a decline toward $68.88, with the June low at $60.13 serving as the more substantial support level.
The Relative Strength Index currently reads near 54, indicating modest positive momentum without entering overbought territory. The MACD indicator is converging with its signal line, suggesting a neutral market structure.
Get 3 Free Stock Ebooks
Discover top-performing stocks in AI, Crypto, and Technology with expert analysis.
- Top 10 AI Stocks - Leading AI companies
- Top 10 Crypto Stocks - Blockchain leaders
- Top 10 Tech Stocks - Tech giants


