


Key Takeaways
- Solana is currently changing hands at approximately $76.80, marking a 2.66% increase over the last 24 hours while challenging the upper trendline of a descending channel pattern near $76
- The daily Relative Strength Index registers 42, while the MACD indicator remains in bearish territory, reflecting subdued buying momentum
- Critical overhead resistance zones are positioned at the 50-day exponential moving average ($76.32), the 200-day exponential moving average ($92.59), and a confluence of moving averages spanning $108 to $123
- Circle recently issued 250 million USDC tokens on the Solana blockchain, boosting stablecoin availability across the ecosystem
- Market technicians have identified potential upside objectives at $84, $123, and $140 contingent upon a confirmed breach of present resistance barriers
At press time, Solana is exchanging hands near the $76.80 mark, reflecting approximately 2.66% gains during the past 24-hour period. The asset’s daily transaction volume stands at roughly $1.31 billion.
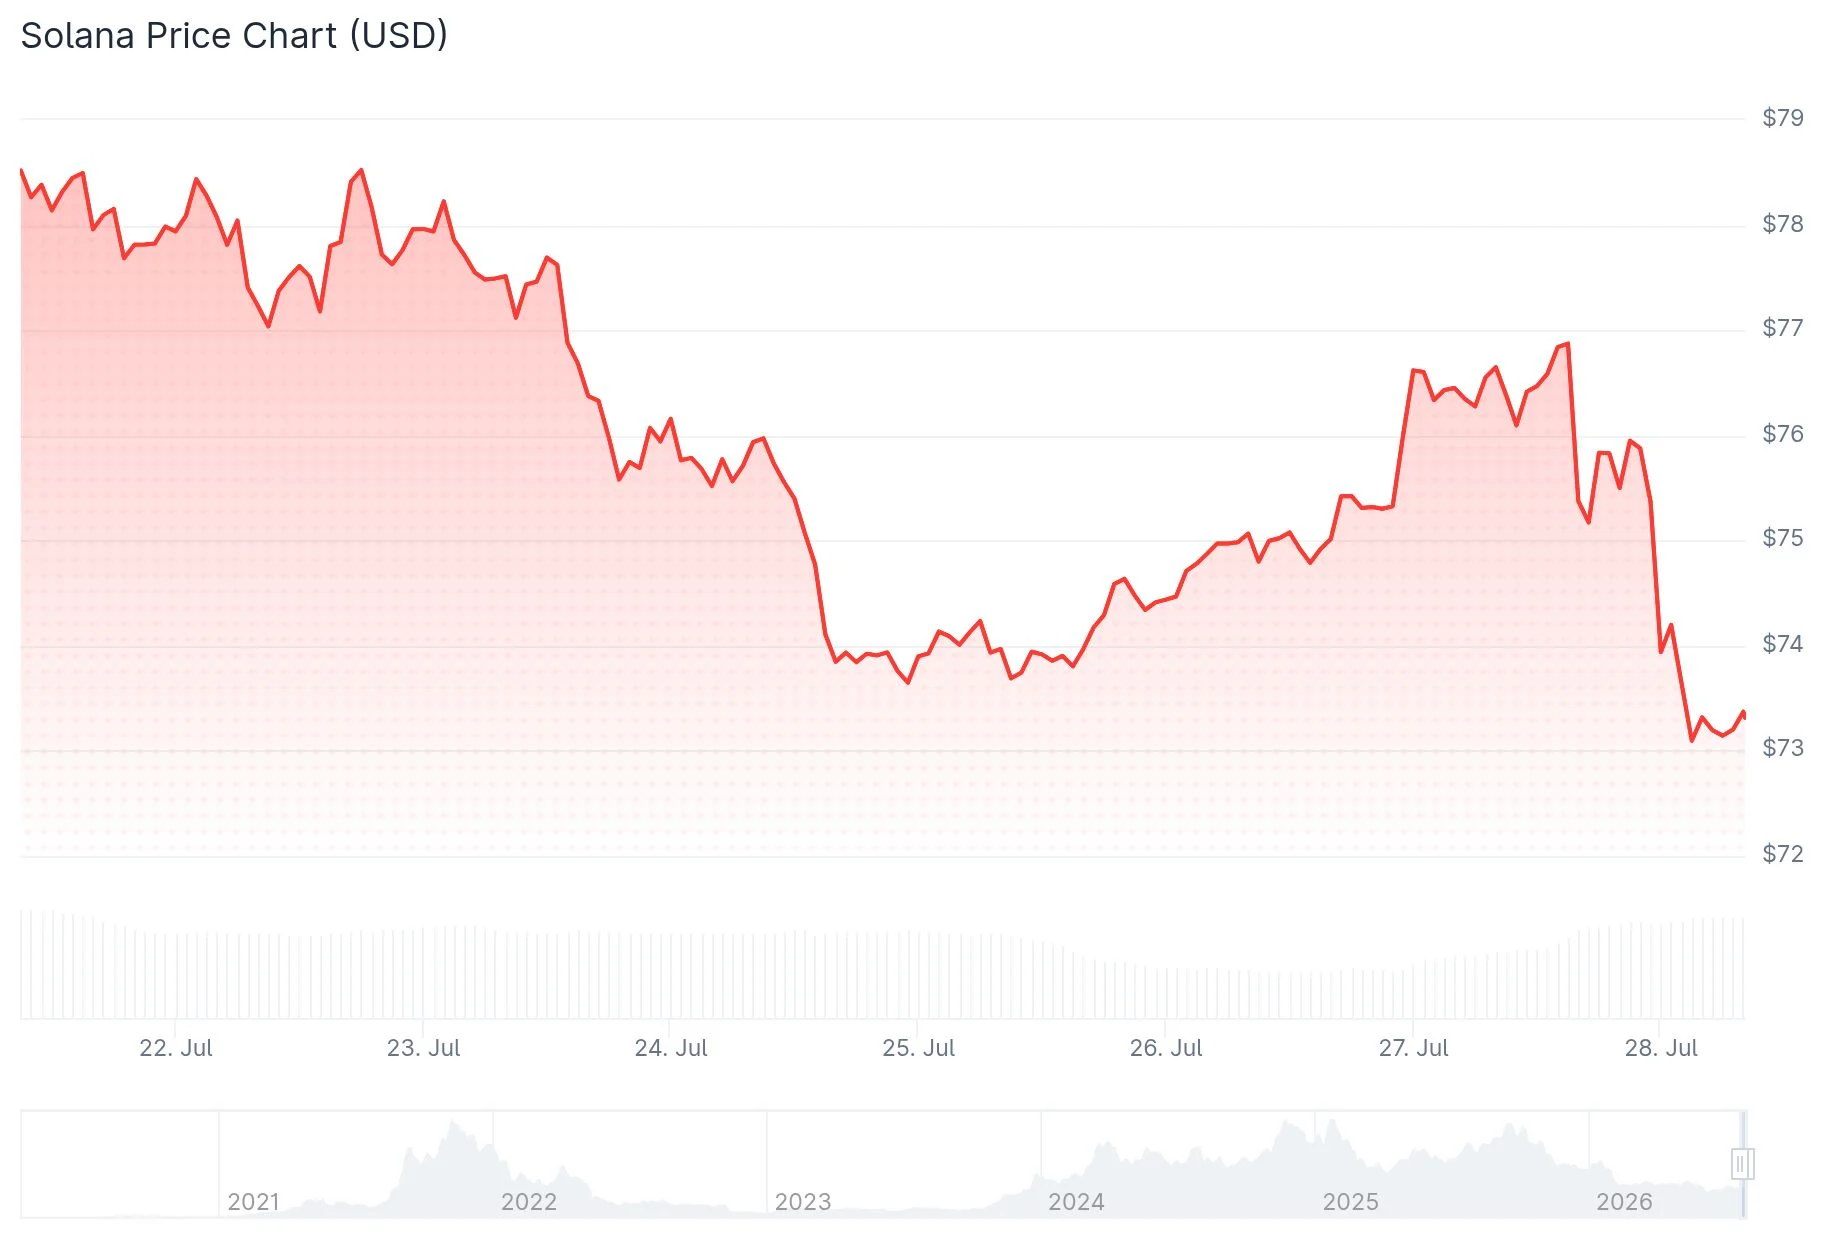
The digital asset is presently challenging the upper resistance line of a near-term falling channel formation around $76. Examining the four-hour timeframe reveals that SOL has been establishing progressively higher lows within this pattern, while the RSI has climbed to approximately 59.86, positioned above its signal threshold at 48.03.
A decisive breakout above this channel structure could pave the way toward the $80 to $84 price range. Conversely, rejection at current levels may result in a retracement toward support between $74 and $75.
The daily timeframe presents a more reserved outlook. The RSI lingers around 42, suggesting limited buying interest, while the MACD continues trading beneath its signal line. Both the 50-day exponential moving average positioned at $76.32 and the 200-day exponential moving average at $92.59 remain above the current trading price, functioning as substantial resistance barriers.
Should bearish pressure intensify, potential downside objectives include the February 6 trough at $67.50 and the June 6 bottom at $60.13.

Higher Timeframe Analysis Reveals Strong Support Region
Examining the weekly chart, SOL maintains its position within an extensive demand area that has historically drawn accumulation during market corrections. Market analyst Crypto King highlighted on X that SOL presents one of the more attractive high-timeframe configurations currently available, characterizing the present zone as a significant demand area and recommending accumulation strategies while this support level persists.
The weekly Relative Strength Index hovers near 40.10, indicating momentum is gradually rebuilding without approaching overbought conditions.
Technical Roadmap Projects Move Toward $143
Market technician Gum has identified that resistance spanning from $75 to $140 appears relatively dispersed and distributed across a broad spectrum rather than consolidated at specific price points. The 20-week exponential moving average positioned around $83.75 represents the initial crucial level requiring reclamation. Beyond that threshold, a convergence of moving averages exists between $108 and $123. The annual opening price near $143.44 emerges as the subsequent major higher-timeframe objective should Solana successfully navigate through that resistance cluster.
Circle’s recent minting of 250 million USDC on the Solana network enhances the stablecoin liquidity pool accessible throughout the ecosystem for decentralized finance applications, payment systems, and exchange operations. This development provides a fundamental catalyst complementing the technical structure, although price action must independently validate any breakout scenario.
SOL is presently maintaining support within the $74 to $76 range while testing descending channel resistance. The weekly demand region remains defended, with the yearly opening price near $143.44 standing as the next significant higher-timeframe milestone.
Get 3 Free Stock Ebooks
Discover top-performing stocks in AI, Crypto, and Technology with expert analysis.
- Top 10 AI Stocks - Leading AI companies
- Top 10 Crypto Stocks - Blockchain leaders
- Top 10 Tech Stocks - Tech giants


