


TLDR
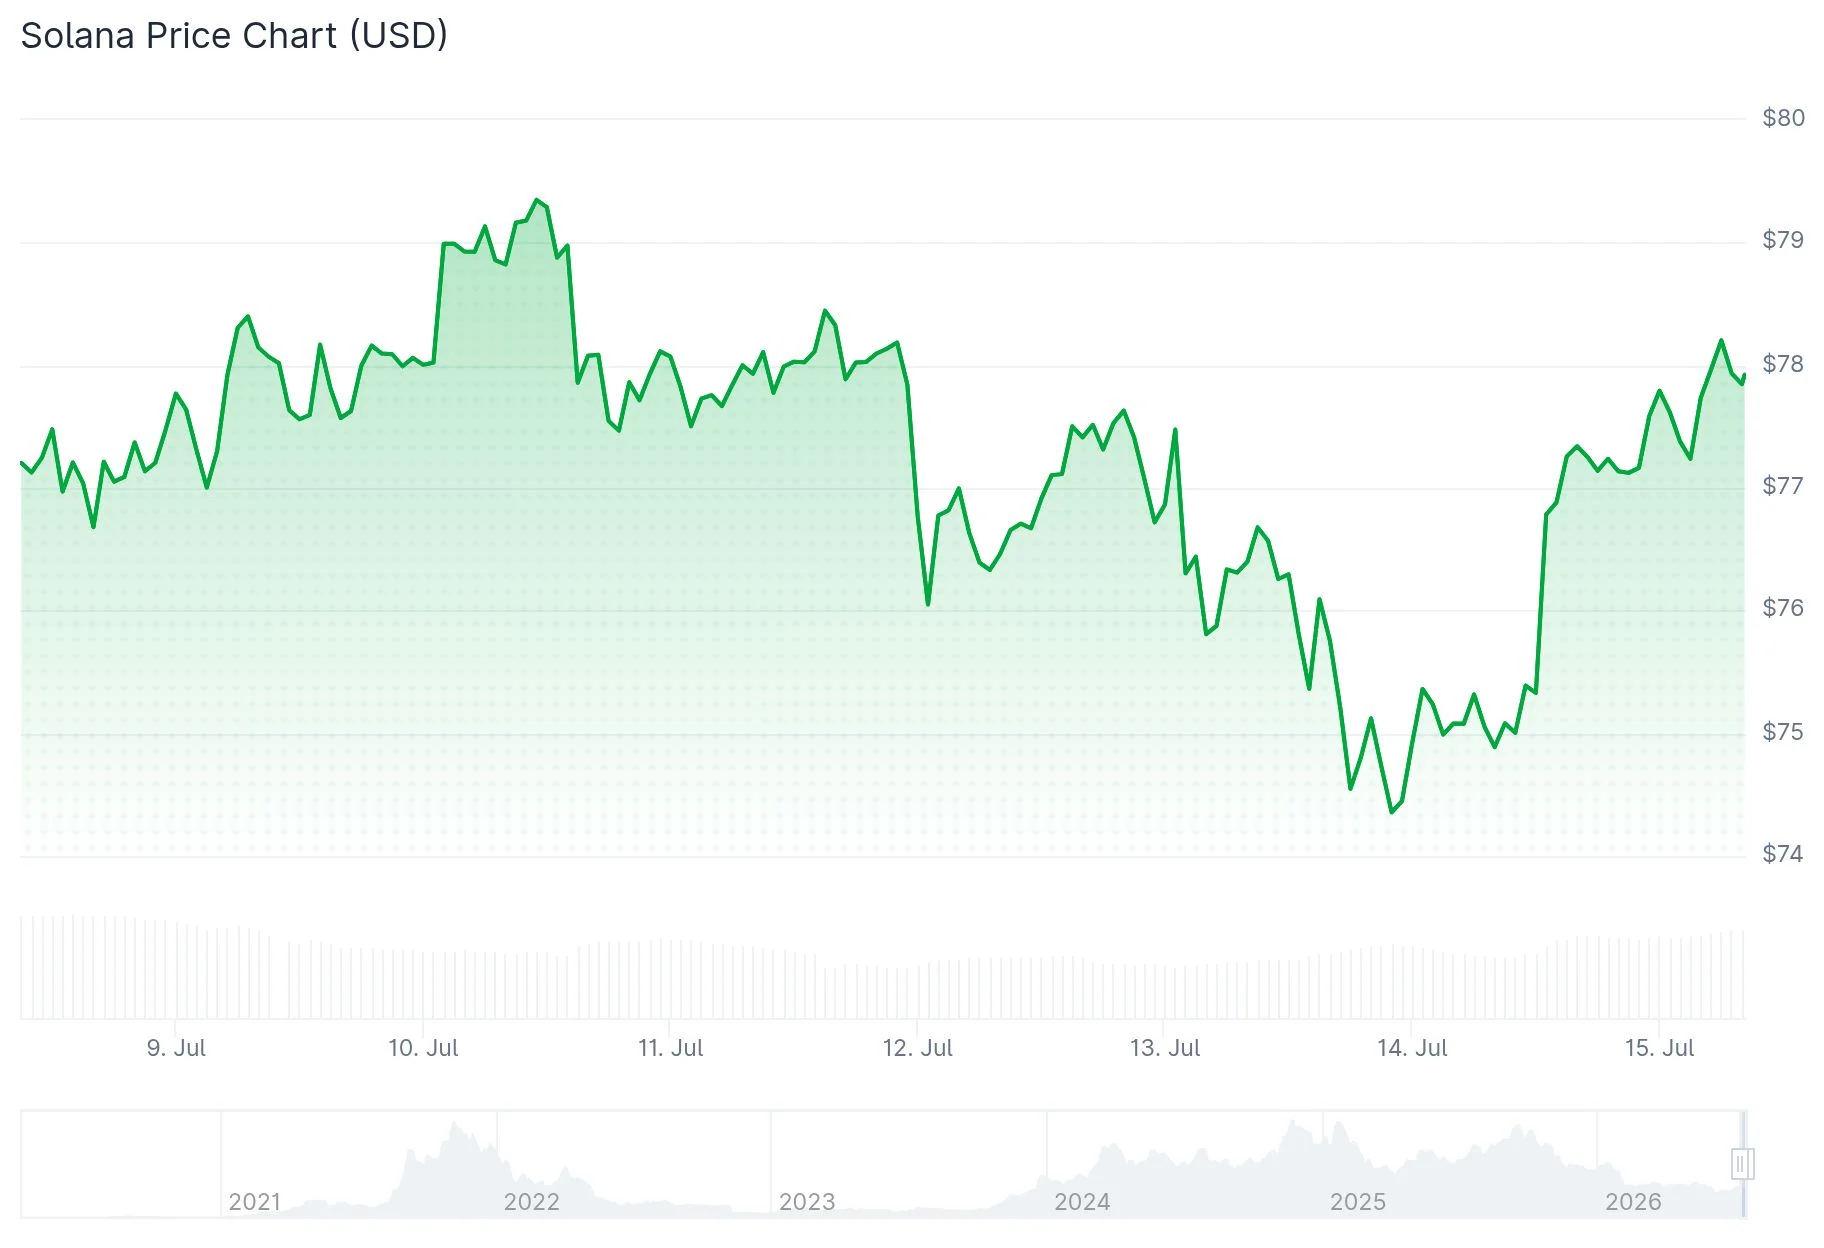
- SOL currently hovers between $77–$78, marking nearly a 30% increase from the June bottom of $60
- Critical resistance zone identified at $89–$92; clearing this level could pave the way to $100
- The Solana Foundation announced a strategic partnership with SBI Holdings for building blockchain-based financial infrastructure in Japan
- Decentralized exchange activity on Solana exceeded $4 billion in a 24-hour period, surpassing competing networks
- The $74–$75 range represents crucial support; losing this zone might trigger a decline toward $68.57
The Solana network has demonstrated impressive strength in recent weeks, posting approximately a 30% gain from its June trough around $60. SOL now trades in the $77–$78 region, maintaining position above an important support level that market observers are monitoring with interest.
According to CoinMarketCap data, 24-hour trading activity hit $3.87 billion, while the network’s market capitalization stands at approximately $44.79 billion. SOL is currently positioned near the middle Bollinger Band at $76.73, with resistance at the upper band of $84.89 and support at the lower band of $68.57.
Price action continues to unfold within an ascending channel formation, characterized by progressively higher peaks and troughs. This technical structure indicates strengthening buyer momentum, although the advance has yet to penetrate its next significant resistance barrier.
Institutional Partnerships Bolster Sentiment
SBI Holdings, a major Japanese financial services firm, has entered into a collaboration with the Solana Foundation to establish blockchain-based financial infrastructure. The initiative will concentrate on stablecoin integration, tokenization of real-world assets, and facilitating international payment systems.
This strategic alliance strengthens Solana’s narrative around institutional acceptance and has played a role in enhancing market confidence surrounding the token.

Network metrics support the optimistic outlook. Solana’s blockchain handled over $4 billion in decentralized exchange transactions within a single 24-hour timeframe, demonstrating superior performance compared to rival platforms during that measurement period.
Cryptocurrency analyst Ali Charts highlighted on X that Solana’s ATR trailing stop indicator has moved beneath the price level for the first time since October 10, generating a SuperTrend buy indication. According to Ali Charts, sustained purchasing momentum could propel SOL toward $96 or potentially $121, while $60 serves as a critical threshold—falling below this point would negate the positive technical setup.
Important Price Levels Under Surveillance
Market analyst BitGuru identified the $74–$75 area as an essential support boundary on July 14. He suggested that maintaining stability above this threshold could facilitate advancement toward $80–$84, whereas failure to hold would likely result in downward pressure.
The MACD indicator currently reads 0.9160, positioned beneath the signal line at 1.2750, accompanied by a negative histogram reading of -0.3590. This configuration suggests diminishing upward momentum in the near term.
The more substantial challenge lies at the $89–$92 supply zone, an area that has successfully repelled price advances on multiple occasions since March. A decisive breach above $92 would establish a clear pathway toward the psychologically important $100 threshold.
SOL is currently trading at $77.01, up 1.74% in the past 24 hours.
Get 3 Free Stock Ebooks
Discover top-performing stocks in AI, Crypto, and Technology with expert analysis.
- Top 10 AI Stocks - Leading AI companies
- Top 10 Crypto Stocks - Blockchain leaders
- Top 10 Tech Stocks - Tech giants


