


Key Highlights
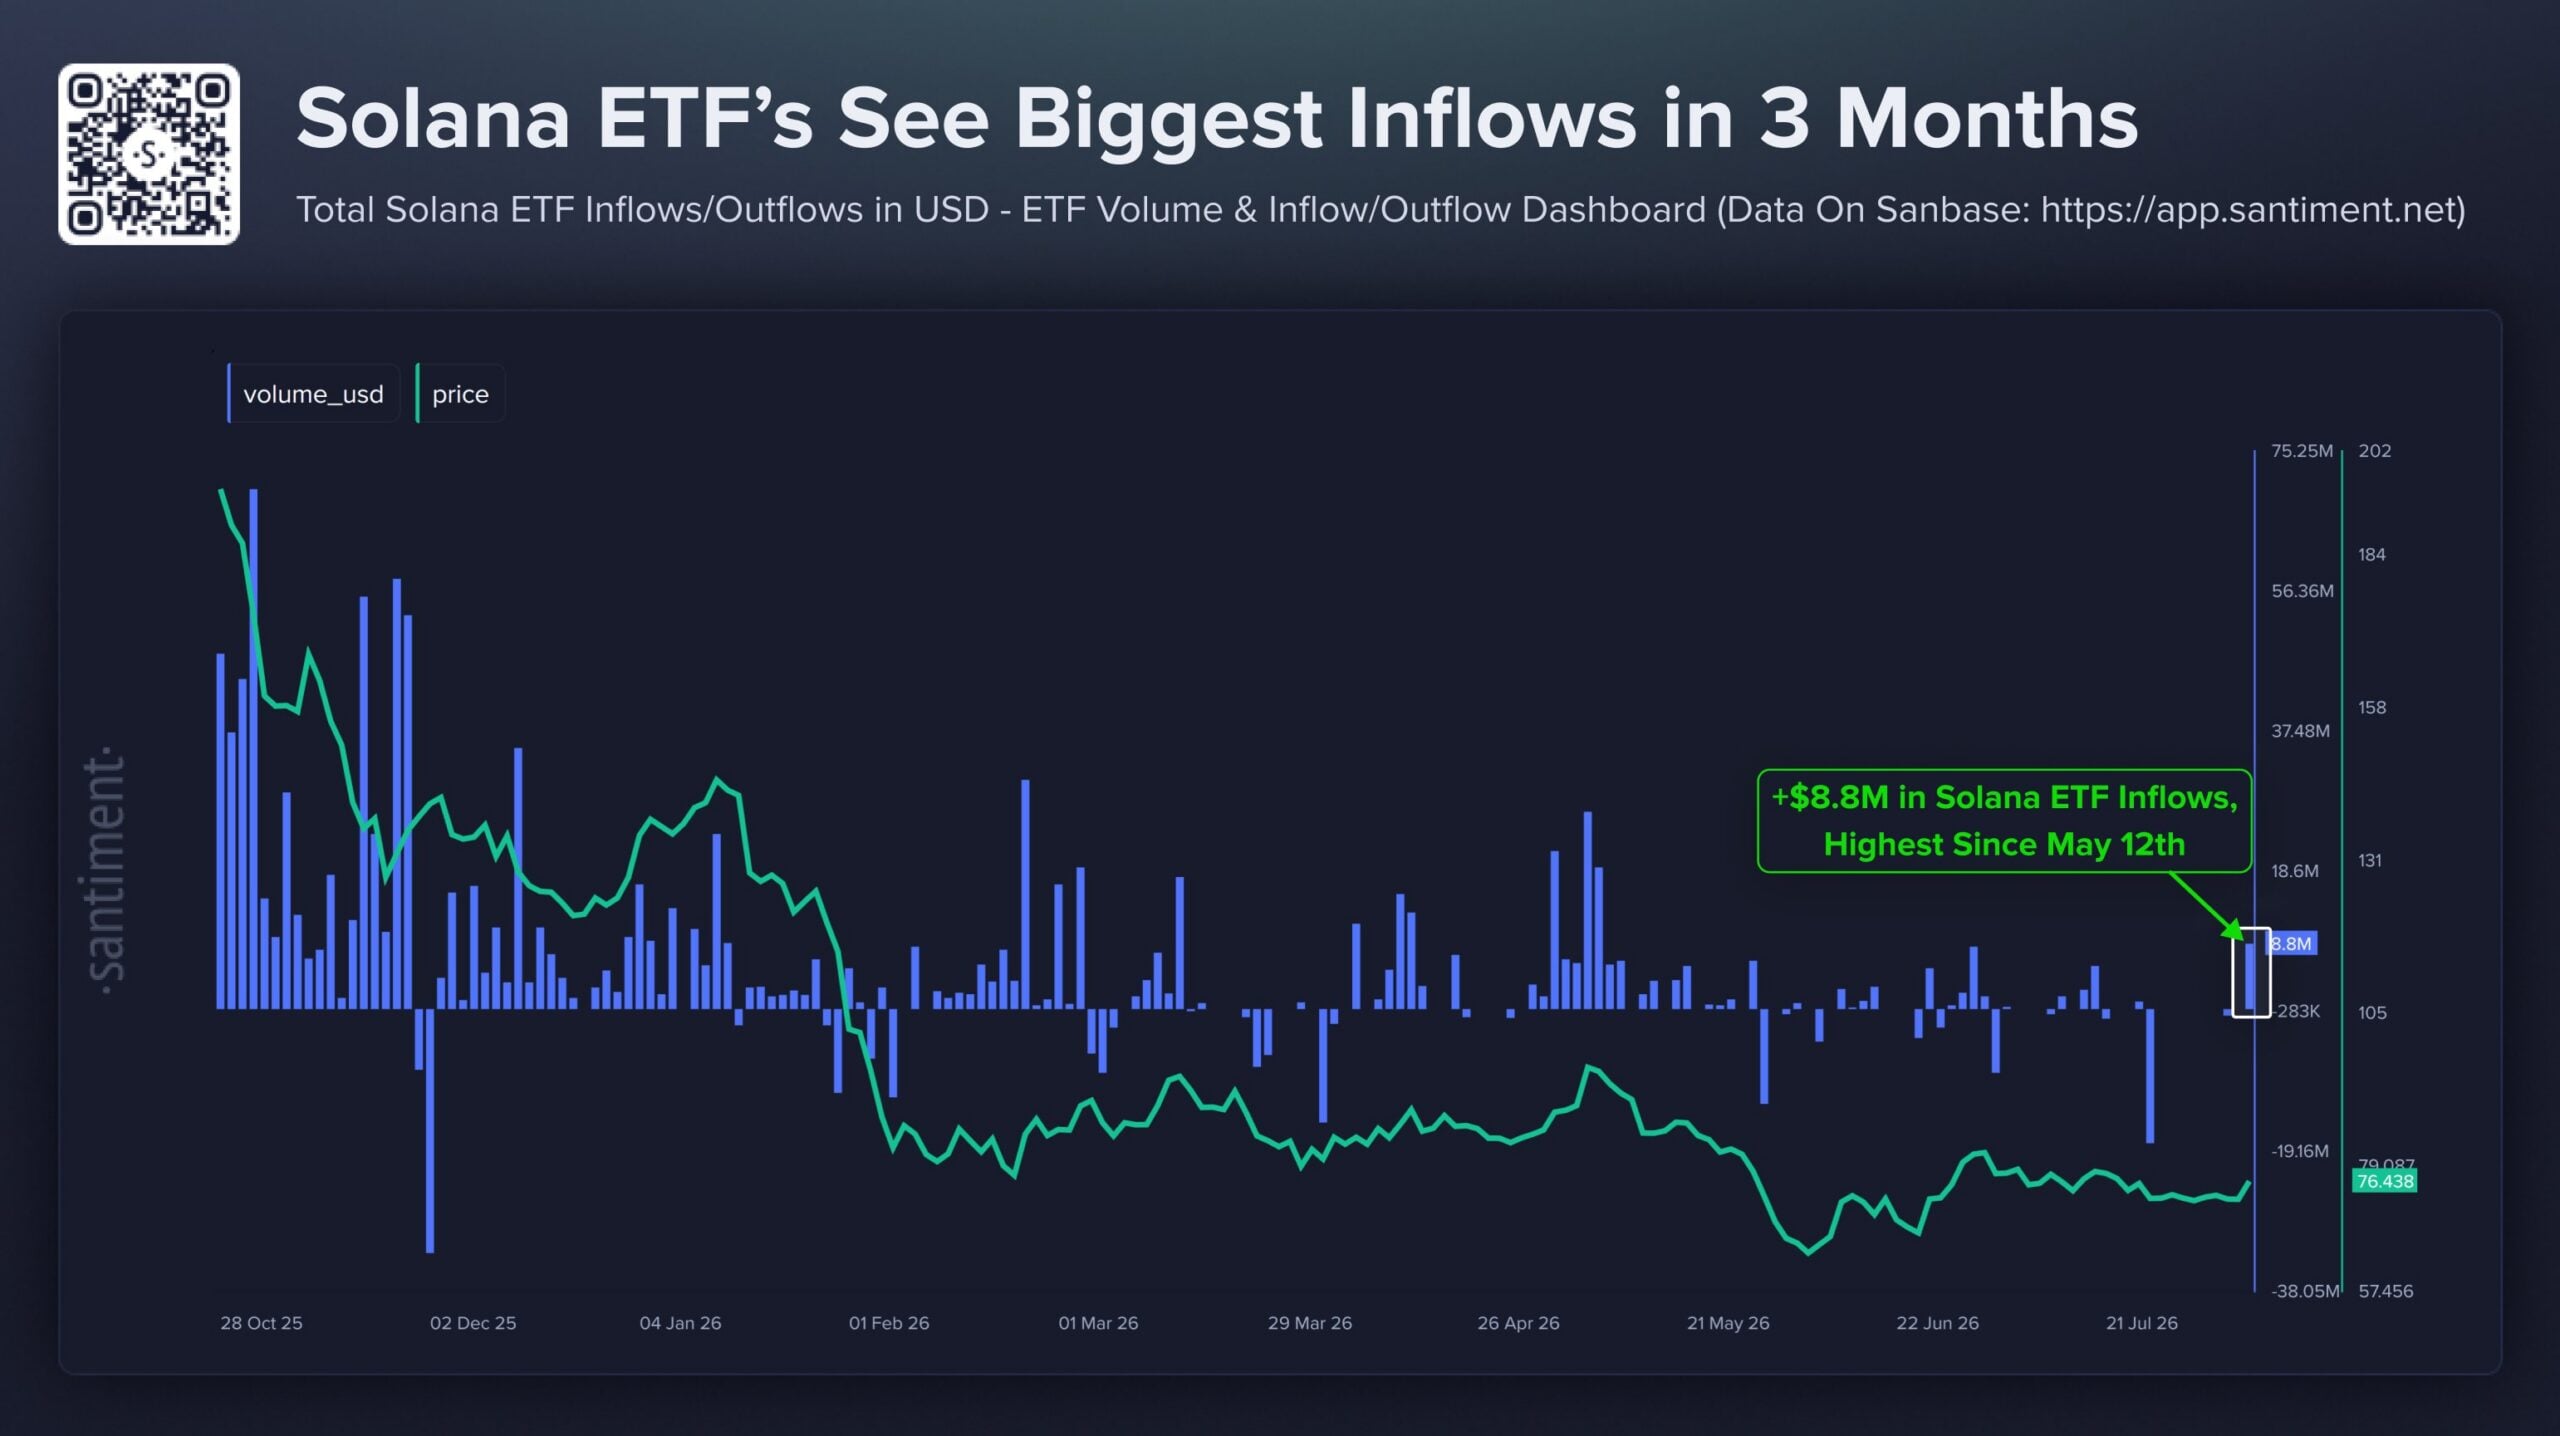
- ETF investments in Solana reached $8.8 million, marking the strongest quarterly performance
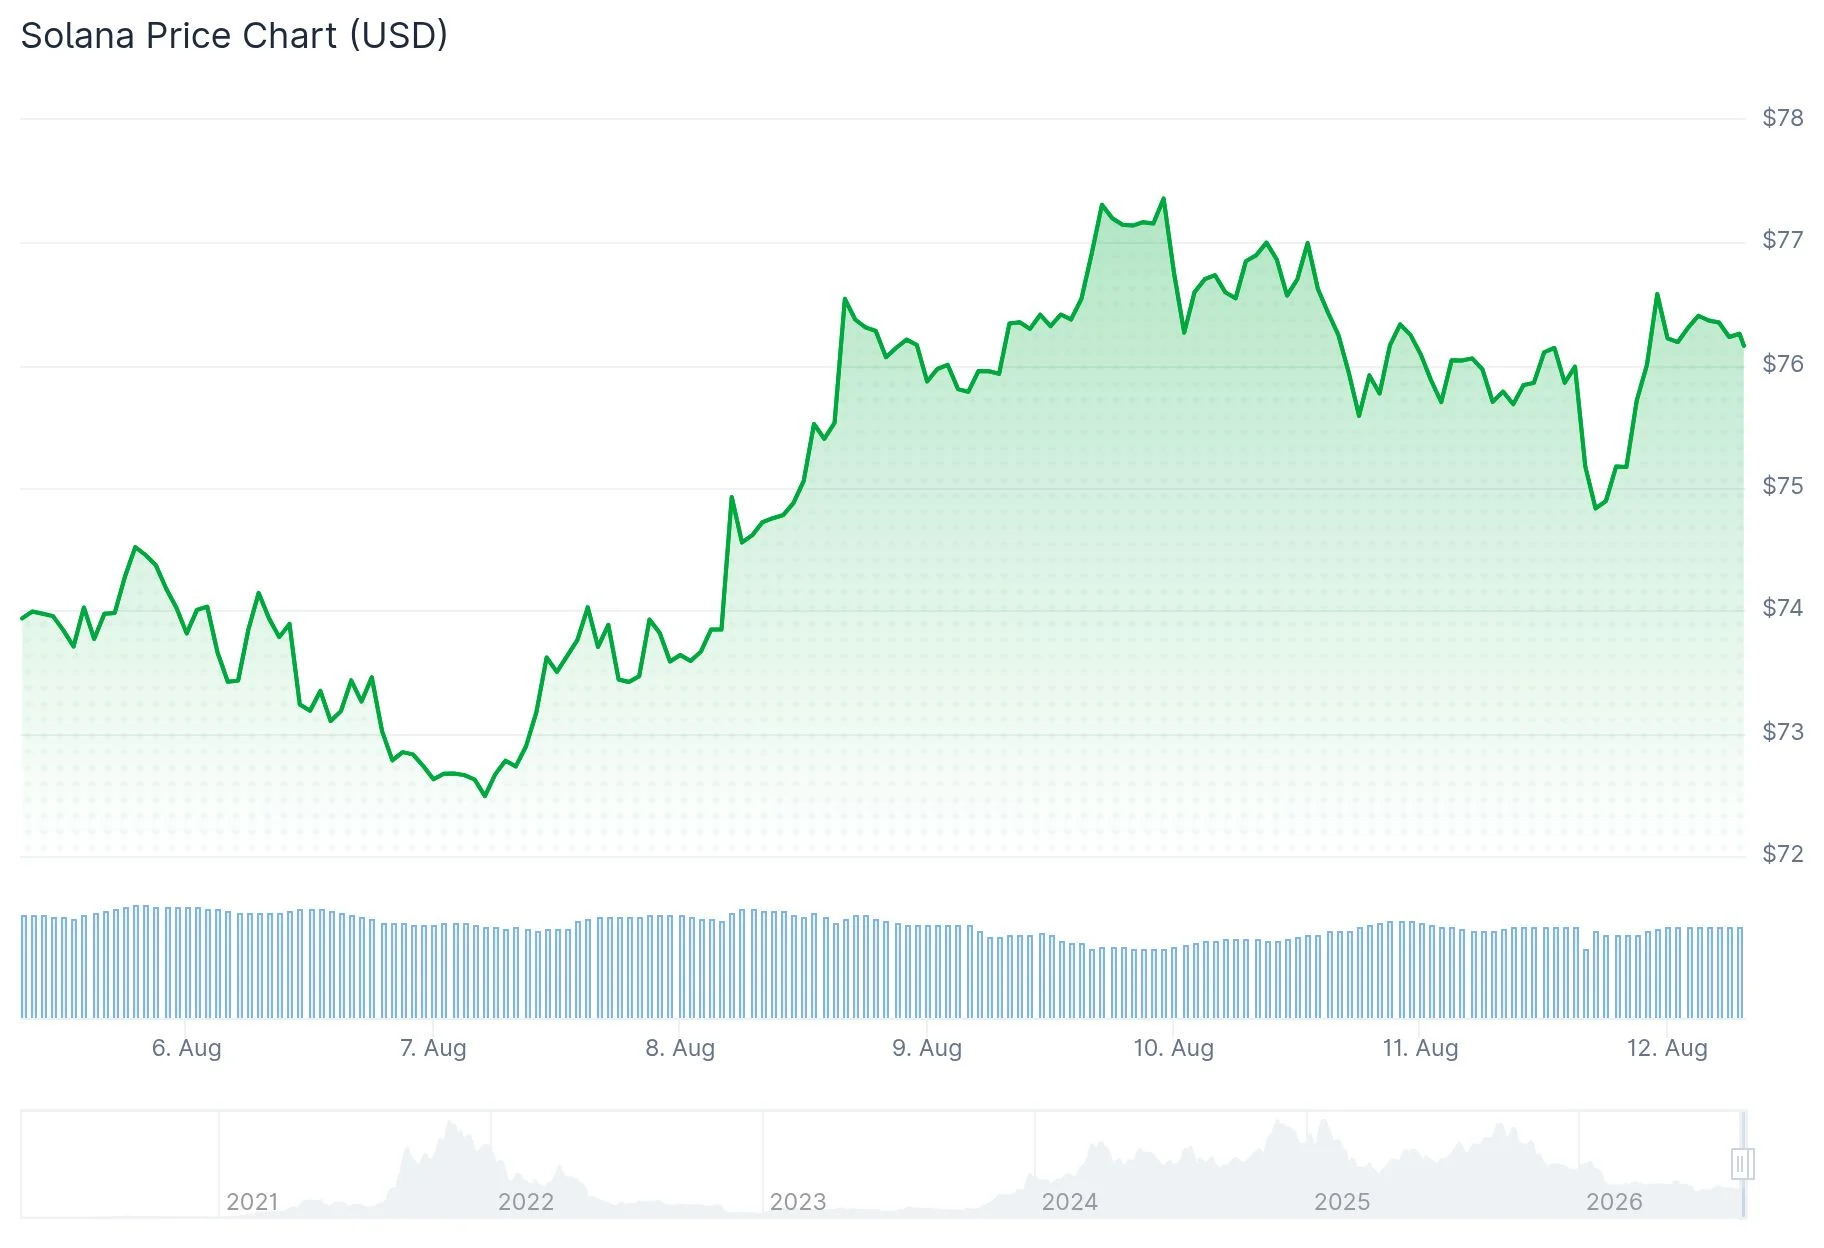
- SOL experienced a 1.16% decline to $74.88 on Tuesday following a week-long uptrend
- Critical resistance zones identified at $77, $90, and $100; primary support established at $74
- MoneyGram integrated its Ramps platform with Solana, enabling cash-to-crypto functionality in 170+ nations
- Technical analyst Bluntz identifies weekly bullish divergence on SOL, indicating possible market bottom
Solana (SOL) experienced a modest pullback of 1.16% on Tuesday, settling at $74.88 as traders took profits following a seven-day upward trajectory. The cryptocurrency market broadly reflected this trend, with overall market capitalization declining 0.6% to $2.17 trillion.
While prices retreated, institutional appetite for Solana remained robust. Exchange-traded funds focusing on SOL registered net inflows totaling $8.8 million — representing the strongest performance since May 12, based on Santiment analytics. This capital influx occurred with SOL hovering near $76.44, signaling growing institutional confidence despite volatile market dynamics.
The ETF landscape for Solana has shown mixed patterns recently, with certain trading sessions recording modest outflows. However, the current $8.8 million figure represents a significant milestone, surpassing all activity recorded during June, July, and the first half of August.
MoneyGram Integrates Cash Infrastructure with Solana Ecosystem
MoneyGram revealed on August 11 that its Ramps platform would extend to the Solana blockchain. This infrastructure, which was previously exclusive to Stellar, now enables Solana-based wallets, exchanges, and application developers to facilitate seamless cash-to-cryptocurrency and cryptocurrency-to-cash transactions.
Rift wallet pioneered the integration, becoming the inaugural Solana application to incorporate MoneyGram Ramps functionality. MoneyGram’s extensive network reaches more than 60 million users through approximately 500,000 physical locations spanning over 170 countries worldwide.

The Ramps platform facilitates cash deposits across 25+ nations and enables withdrawals in more than 170 countries and regions. Development teams can integrate this functionality via the Solana Developer Platform’s payments module, eliminating the need to construct proprietary banking connections.
Previously, MoneyGram had established itself as a network validator on Solana in June, actively staking SOL tokens and participating in transaction validation processes.
Market Analysis and Technical Indicators
Examining the four-hour trading chart reveals that SOL momentarily climbed to $77.40 before encountering resistance that drove prices back toward the $75 level. The MACD indicator currently reads 0.19, positioned beneath the 0.46 signal line, while the histogram displays -0.27, suggesting near-term downward momentum.
The Relative Strength Index has descended to 44.46, falling below the neutral 50 threshold, reflecting weakening buyer momentum. For bulls to maintain control, SOL must defend the $74 support level to prevent further declines toward $73 or potentially $72.
Cryptocurrency market analyst Bluntz (@Bluntz_Capital) observed on X that SOL demonstrates “strong price action” and highlighted a weekly bullish divergence pattern that could signal a market bottom formation. He characterized the current market phase as an accumulation zone for strategic investors.
A sustained break above $75 would indicate renewed bullish momentum, establishing $76 and $77 as subsequent resistance targets. Should SOL breach the $90 threshold, the pathway toward $100 becomes increasingly viable.
SOL was last trading at $78.33.
Get 3 Free Stock Ebooks
Discover top-performing stocks in AI, Crypto, and Technology with expert analysis.
- Top 10 AI Stocks - Leading AI companies
- Top 10 Crypto Stocks - Blockchain leaders
- Top 10 Tech Stocks - Tech giants


