


TLDR
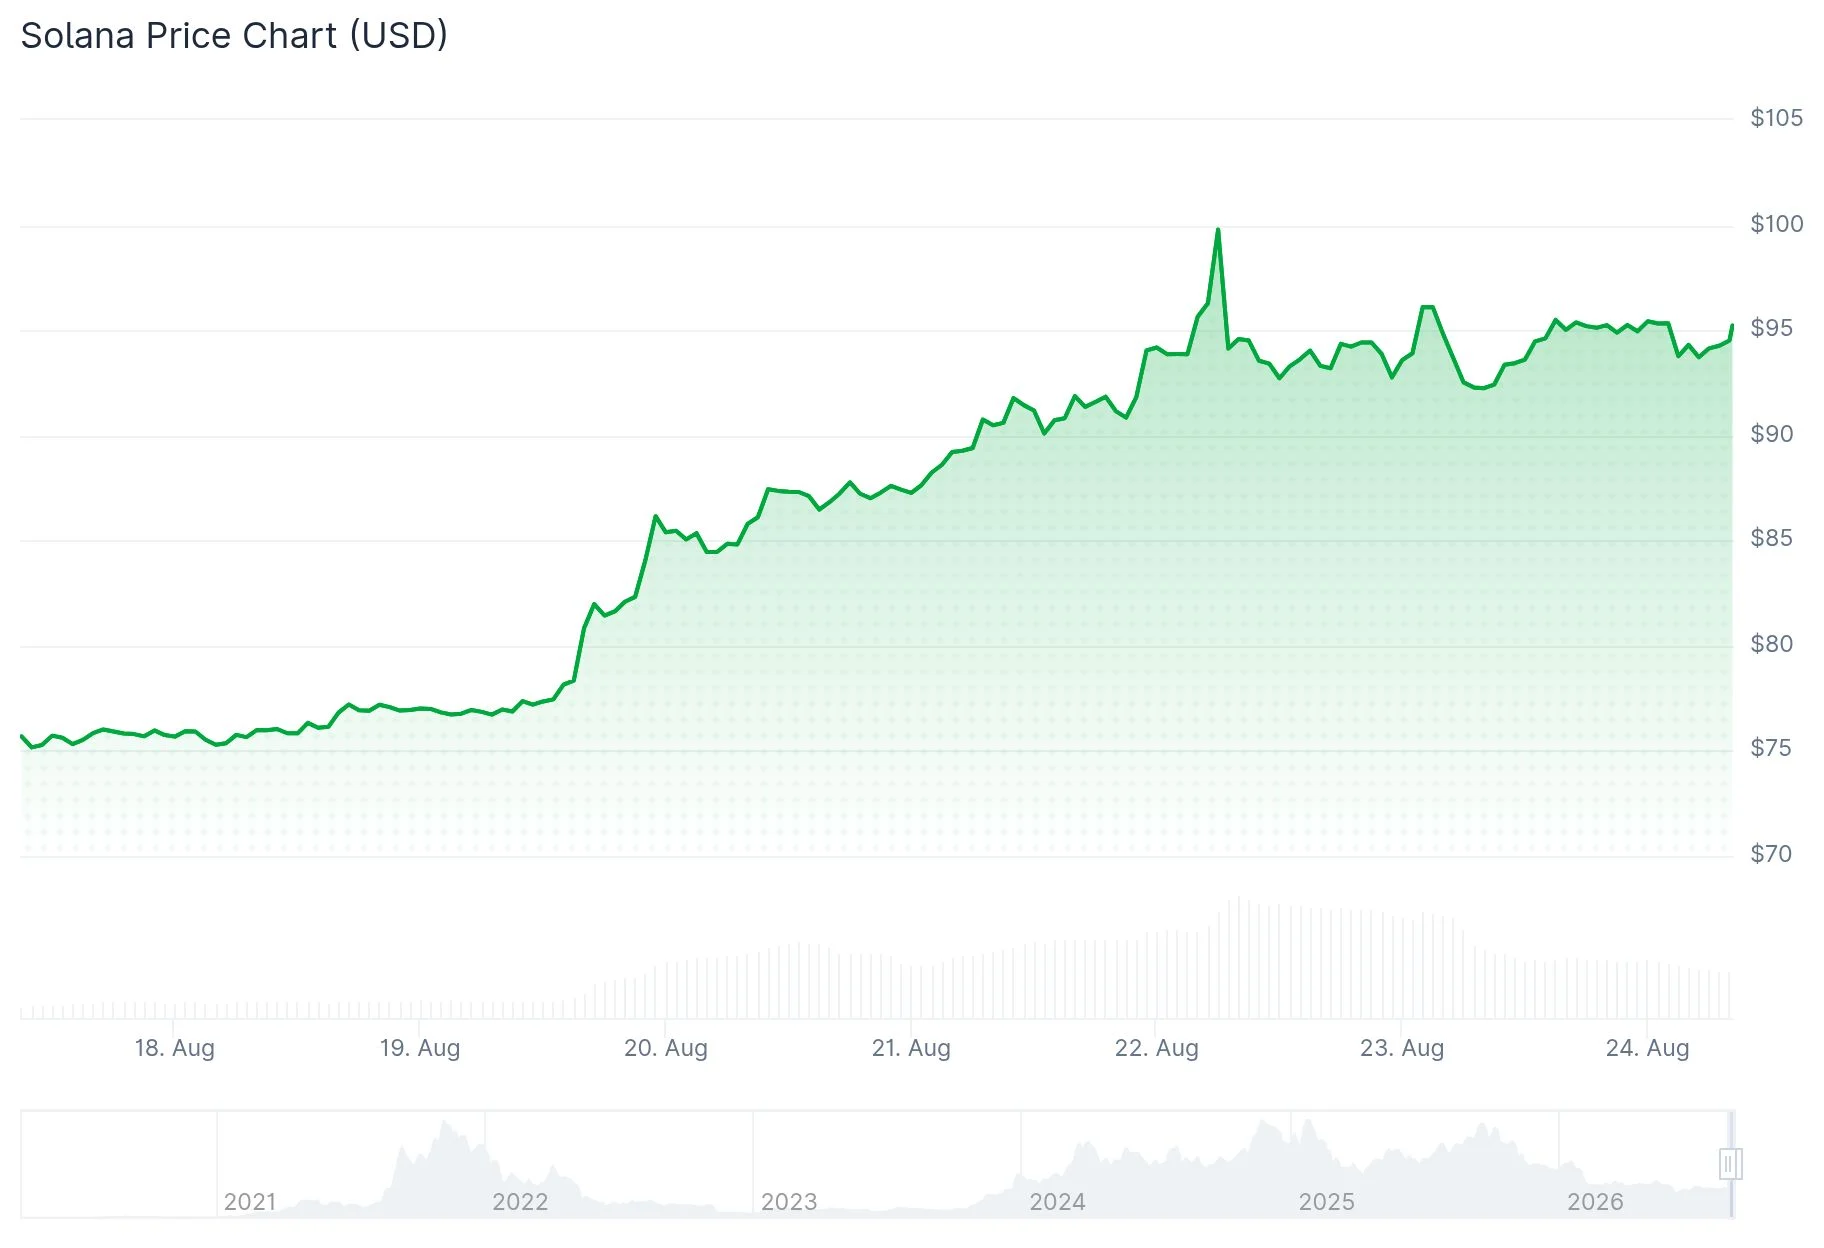
- Solana jumped 8.70% over the last 24 hours, reaching $97.09 with a market capitalization hovering around $56.56 billion
- The token surpassed $90 for the first time in three months, clearing two critical resistance zones
- More than $4.6 billion in bearish bets were wiped out within a three-day period
- The token consolidated for 202 days, with $95–$100 representing the crucial breakout threshold
- Should $100 be breached and sustained, market watchers identify $120 as the subsequent significant milestone
Solana has delivered one of its most impressive performances in recent months, rallying from the lower $80s to approach $97 within days. The digital asset posted an 8.70% gain over the past day and has climbed approximately 25% throughout the past week.
Transaction volume has exploded by nearly 50%, reaching $9.5 billion, which represents roughly 17% of SOL’s total circulating market capitalization. This dramatic volume increase catalyzed a substantial liquidation event across derivative markets.
Approximately $4.6 billion in bearish positions were forcibly closed within a 72-hour window as SOL pushed upward. On August 18 alone, $2.9 billion in liquidations occurred, ranking as the 8th largest daily liquidation event in cryptocurrency trading history.
The upward momentum followed the U.S. Securities and Exchange Commission’s unveiling of a proposed regulatory framework addressing crypto assets. This development transformed market sentiment substantially.
The Crypto Fear and Greed Index climbed from approximately 36, indicating neutral sentiment, to roughly 76, demonstrating that market participants have shifted to a greedy stance.

SOL successfully reclaimed its 200-day exponential moving average and overcame two previous resistance zones positioned at $78 and $90. The breakthrough above $90 marked the first occurrence of SOL trading at that level in over three months.
202-Day Accumulation Comes to a Head
Market commentator Ran Neuner highlighted that SOL remained confined within its accumulation zone for approximately 202 days preceding this breakout. The upper limit of this consolidation range exists precisely around the $97–$100 zone, which price action is currently challenging.
A sustained daily close beyond $100, accompanied by a successful backtest, would validate that the range has broken to the upside. Market analyst Altcoin Sherpa has pinpointed $120 as the subsequent major obstacle should this scenario unfold.
Cryptocurrency trader KillaXBT disclosed publicly that SOL has appreciated 50% from his entry position. He identifies $100–$105 as the immediate resistance zone, but anticipates an upward push toward the $120s once that barrier is cleared.
On-Chain Data Backs the Move
Capital flows into Solana ETFs have reached $38 million, marking the strongest positive measurement since May. A bullish crossover between the 30-day and 50-day moving averages for active daily users emerged ahead of this price advance.

When this identical crossover pattern materialized in June 2025, SOL appreciated from $145 to $245 throughout the subsequent months.
Key Levels to Watch
Near-term support resides at $90–$92. A more substantial correction might revisit $83, where the 200-day EMA currently provides support. The RSI has climbed into overbought conditions, elevating the probability of a brief consolidation before any upward continuation.
Solana’s critical price levels include: support at $80–$82, resistance at $95–$100, and bullish objectives at $110–$120, followed by $140, and long-term $200.
Capital inflows to Solana ETFs presently total $38 million, the strongest level recorded since May.
Get 3 Free Stock Ebooks
Discover top-performing stocks in AI, Crypto, and Technology with expert analysis.
- Top 10 AI Stocks - Leading AI companies
- Top 10 Crypto Stocks - Blockchain leaders
- Top 10 Tech Stocks - Tech giants


