


Key Takeaways
- XRP currently hovers between $1.10 and $1.11, facing critical resistance in the $1.1237–$1.1475 zone
- Technical charts reveal a symmetrical triangle formation with analysts projecting $1.35 as the breakout objective
- Perpetual futures funding rates have shifted positive while the 30-day Z-Score crossed above zero, indicating strengthening market sentiment
- The Relative Strength Index rests at approximately 47.85, hovering below the neutral threshold as MACD awaits bullish confirmation
- Critical support is established between $1.08 and $1.10, with a drop beneath $0.93 potentially triggering extended consolidation
XRP continues to trade within a narrow band around $1.10–$1.11 as technical analysts observe the formation of a symmetrical triangle on daily timeframes. Market watchers are closely monitoring whether bullish momentum can overcome overhead resistance and drive the asset toward the $1.35 price zone.
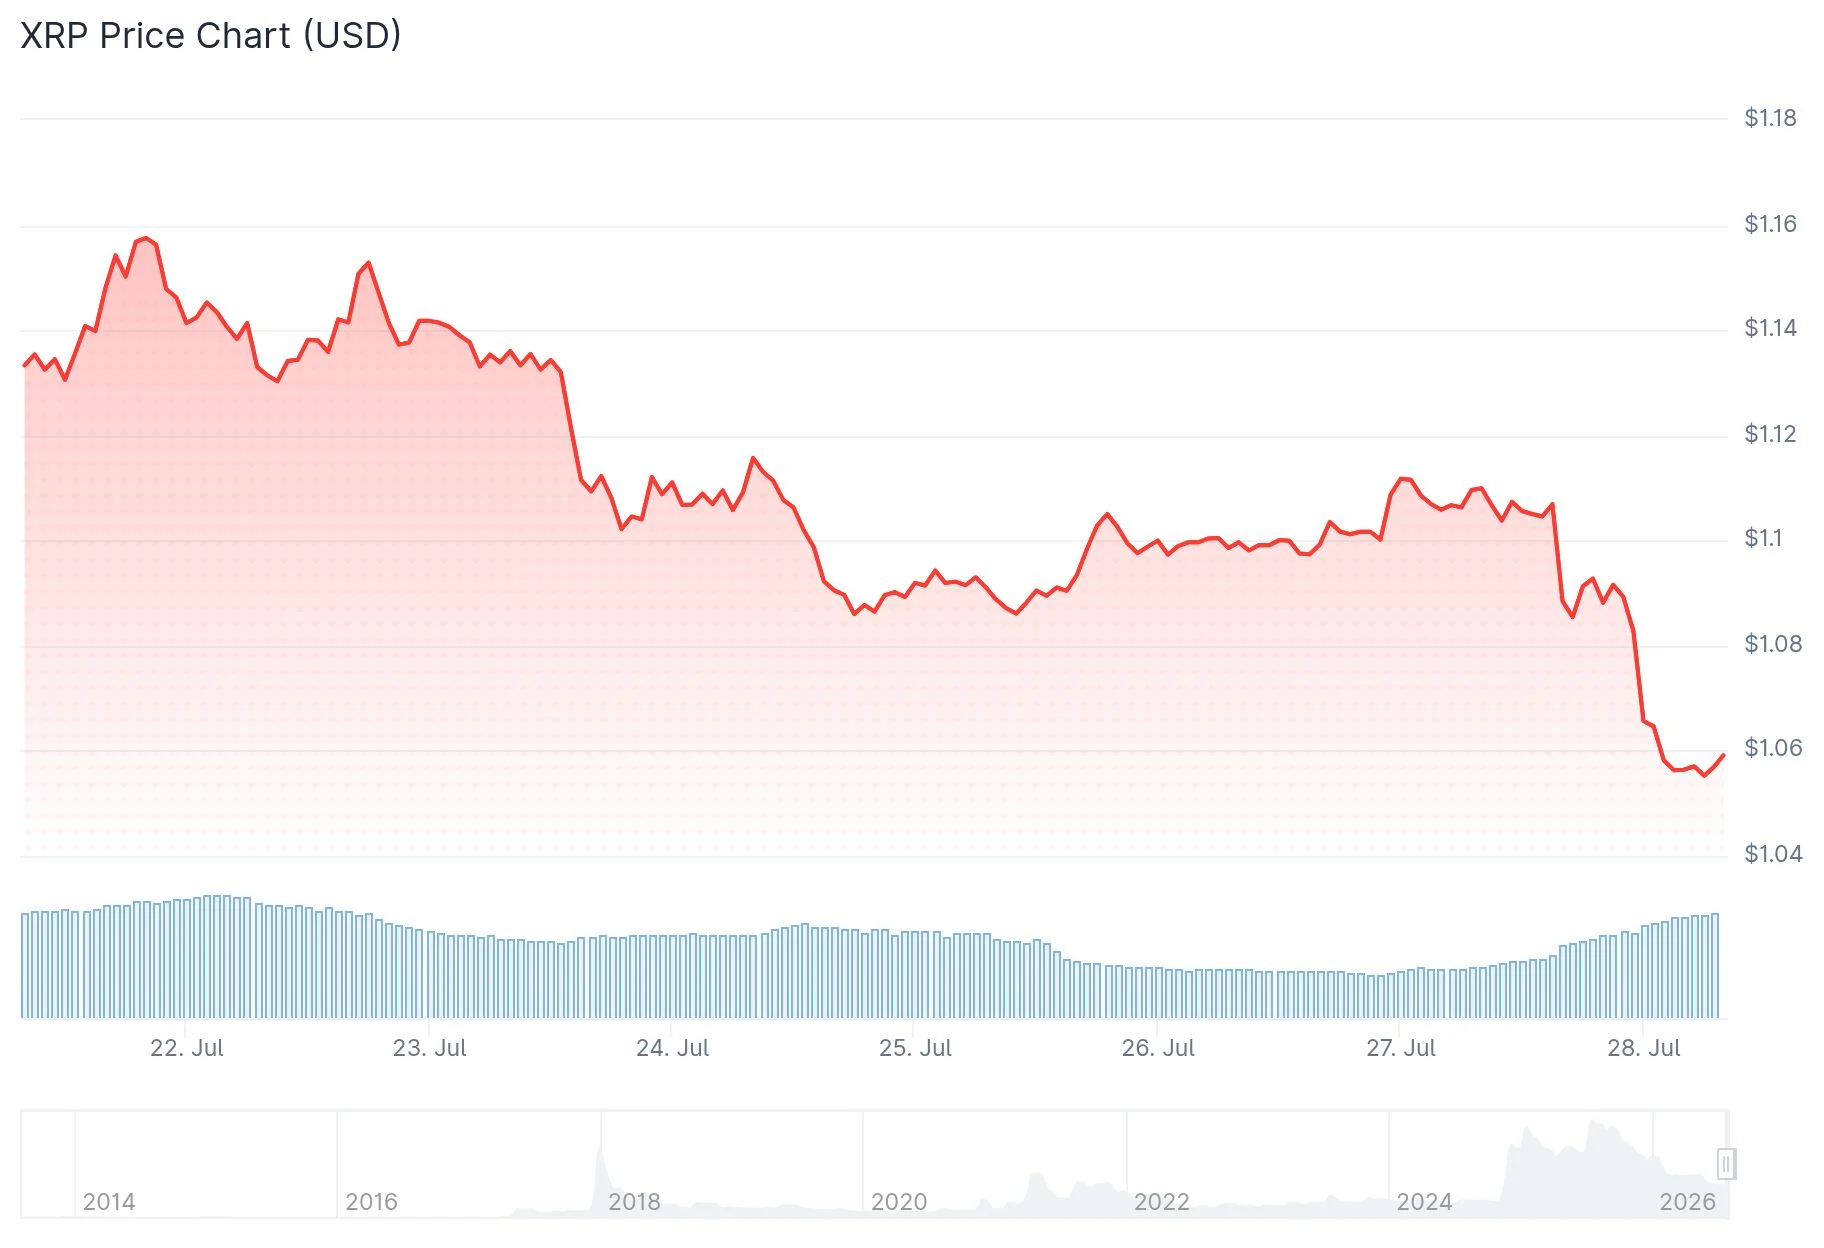
This triangle configuration emerged after XRP’s significant retreat from its 2025 peak above $3.50. Technical assessment from @cryptowithgopal on X reveals narrowing trendlines that indicate declining selling pressure while buyers consistently protect higher support levels. This compression suggests volatility may spike as the pattern nears completion.
Market analyst Crypto Patel drew attention to two positive technical developments. Perpetual futures funding rates have shifted into positive territory, demonstrating that market participants are paying premiums to maintain long exposure. Additionally, the 30-day Z-Score has moved back above the zero line, suggesting XRP now trades above its recent statistical mean following an extended consolidation period.
Notably, spot market buying activity has increased without excessive leverage dependency. Spot transactions represent organic market demand rather than margin-fueled speculation, reducing the likelihood of liquidation cascades during any potential price advance.
Critical Resistance Zones Ahead
The initial obstacle lies at the 50-day exponential moving average positioned near $1.14. Beyond that threshold, XRP encounters resistance around the $1.25 mark, followed by a more substantial confirmation level at $1.3524.

Technical strategist readCrypto pinpoints the $1.1237–$1.1475 range as a pivotal battleground. XRP must successfully recapture this zone and maintain it as a support foundation to establish credibility for a renewed uptrend. A convincing move past $1.3524 would deliver more robust technical confirmation that the overarching downtrend is losing control.
Analyst Diana observes that XRP has established a higher low following its most recent correction, while the RSI has rebounded to the 47.85–48 region. The MACD histogram has shifted into positive territory, hinting that bearish momentum may be weakening, although a definitive bullish signal crossover remains pending.
Downside Support and Risk Assessment
Looking at potential downside scenarios, the $1.08–$1.10 range represents the crucial demand zone worth monitoring. Defending this area preserves the triangle’s structural integrity.
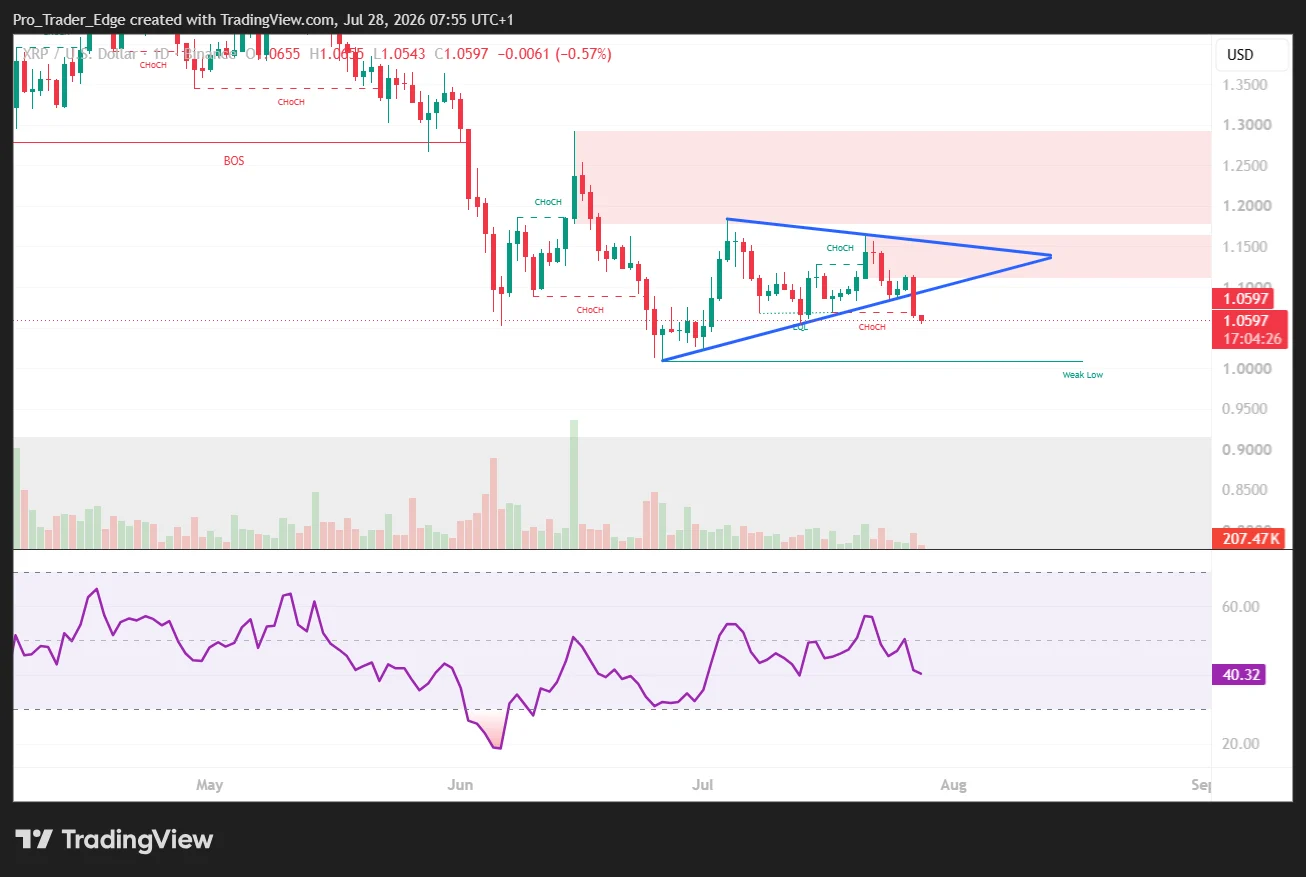
A more substantial support threshold exists at $0.93. A confirmed breakdown below this level could trigger a prolonged consolidation period. XRP’s On-Balance Volume has dropped beneath its Low Line indicator, highlighting the importance of volume-supported recovery for any durable trend establishment.
From a broader perspective, XRP confronts a volume-profile resistance band spanning $1.50 to $1.9669, with the 50-week EMA positioned near $1.60 presenting an additional obstacle.
XRP has secured roughly $1 billion in spot ETF capital inflows while Ripple continues advancing its worldwide payment infrastructure, although the token trades significantly below its 2025 peak levels.
Current market attention centers on XRP’s ability to reclaim and defend the $1.1237–$1.1475 resistance zone as the triangle pattern approaches its critical resolution phase.
Get 3 Free Stock Ebooks
Discover top-performing stocks in AI, Crypto, and Technology with expert analysis.
- Top 10 AI Stocks - Leading AI companies
- Top 10 Crypto Stocks - Blockchain leaders
- Top 10 Tech Stocks - Tech giants


