

Key Takeaways
- XRP slid to approximately $1.20 following a breach of the critical $1.25 support zone amid intense selling pressure on June 2.
- The $1.25 threshold has now converted from a support floor to a resistance ceiling, challenging bullish momentum.
- Market participants are closely monitoring the $1.20–$1.21 range — a failure to hold could trigger a decline toward $1.13–$1.15.
- Several technical analysts believe the current price action may represent a “bear trap,” citing similar patterns observed in 2020, 2023, and 2024.
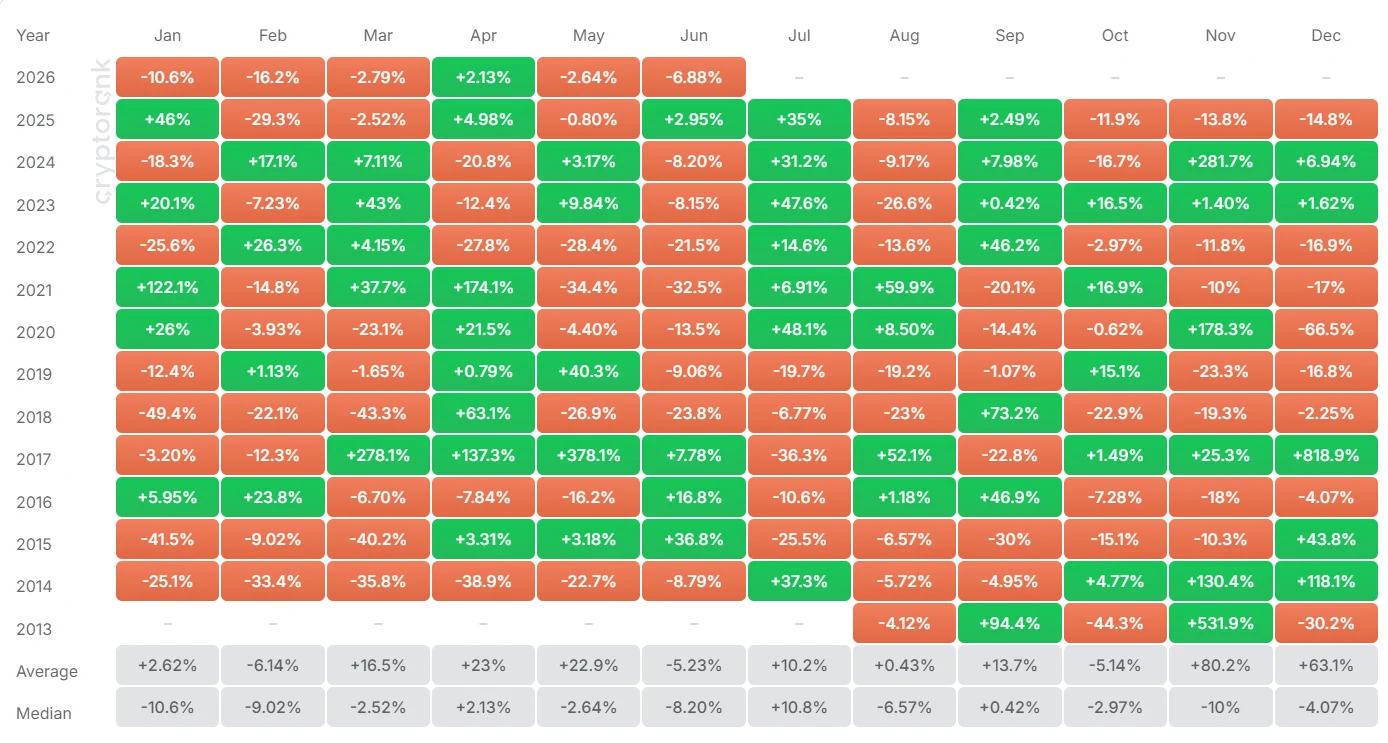
- Historically, June has proven challenging for XRP, averaging approximately -5% returns since 2014.
XRP experienced a sharp decline exceeding 5% on June 2, tumbling from $1.27 to an intraday bottom of $1.18 before stabilizing around the $1.20 mark. This price movement wiped out gains accumulated since early February and violated a significant support threshold closely monitored by market participants.
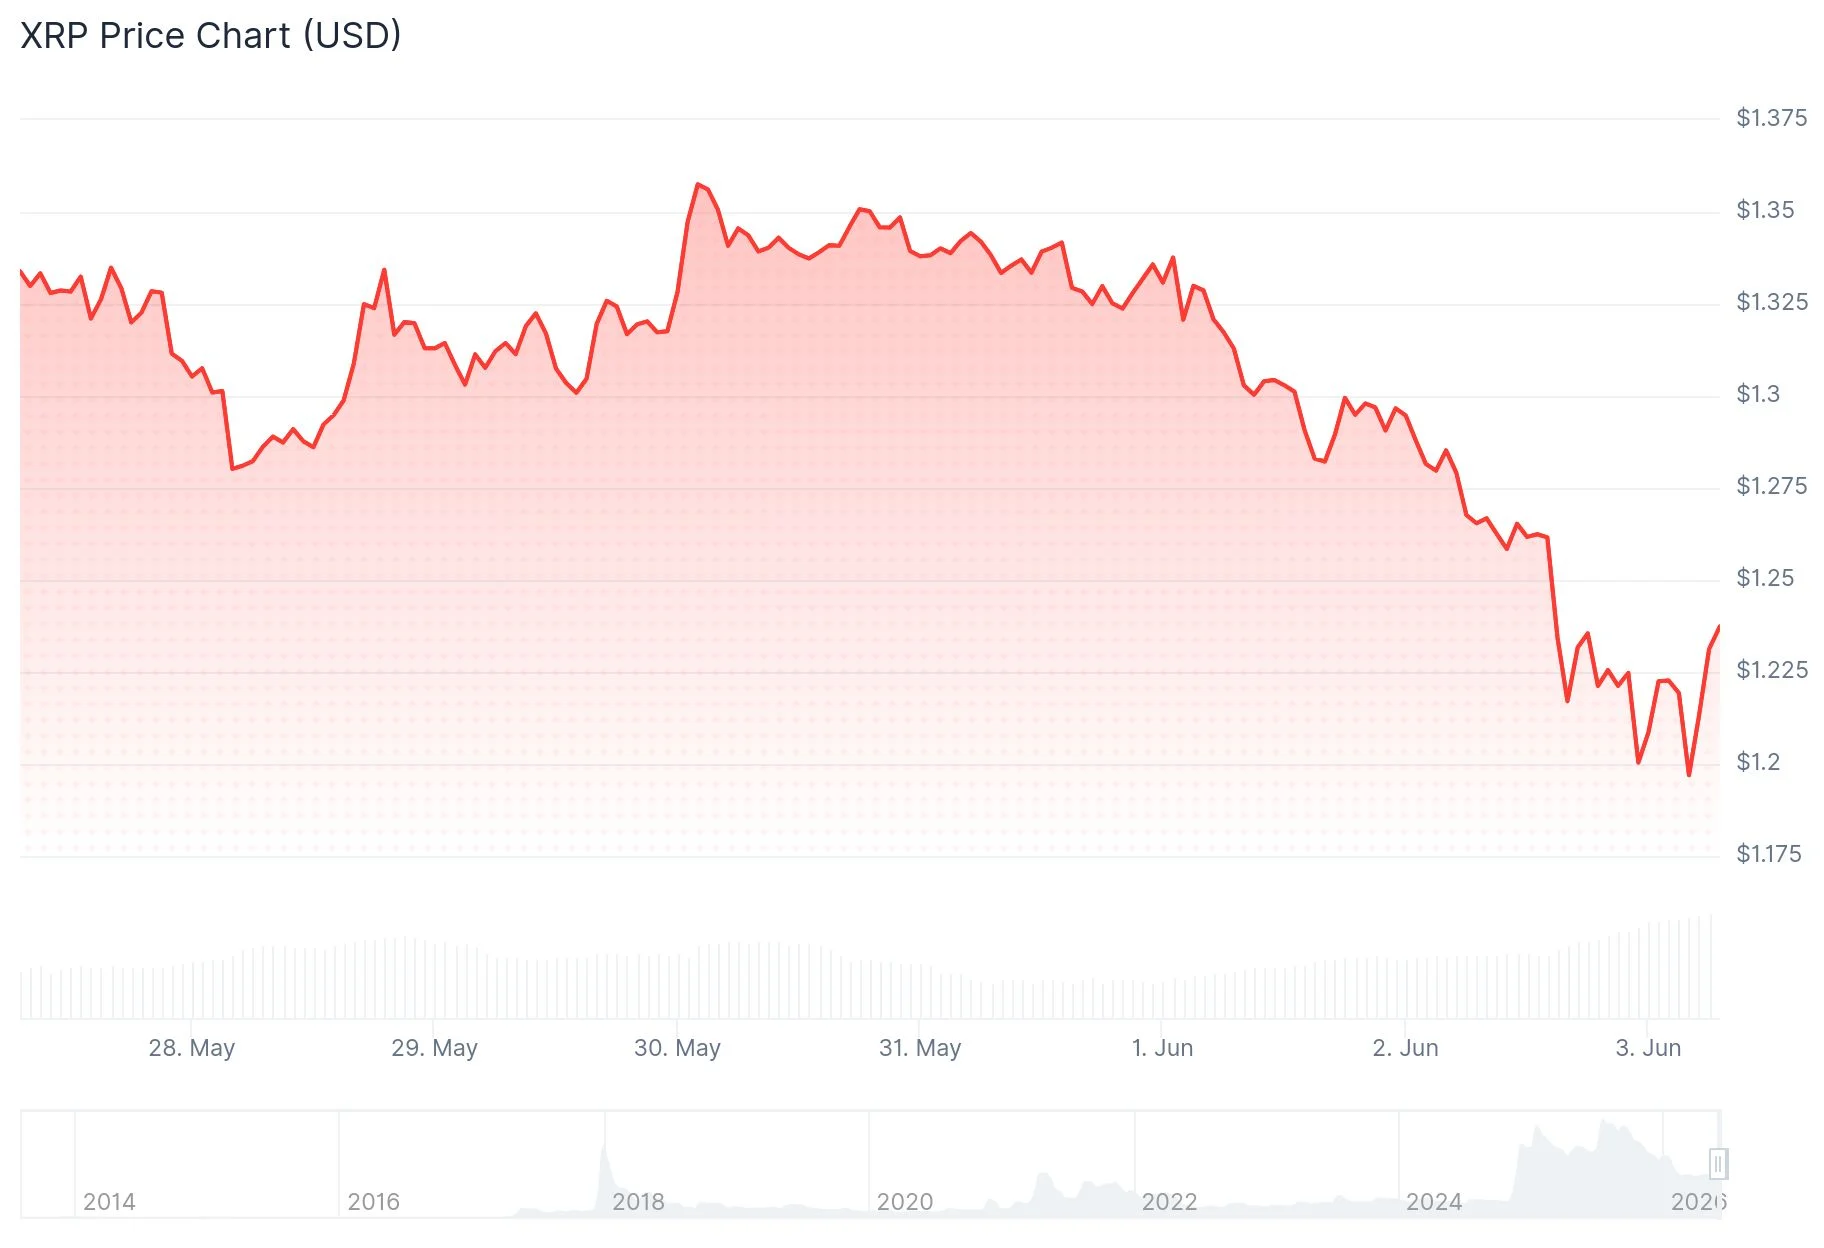
The decline occurred amid broader cryptocurrency market weakness. Trading volume spiked to 205.7 million during the 14:00 UTC session on June 2, coinciding precisely with the breach of the $1.25 support boundary.
Following this breakdown, the $1.25 level has now transformed into overhead resistance. Any attempt at recovery will likely encounter selling activity at this price point before bulls can regain confidence.
Market analyst Egrag Crypto observed on X that XRP is currently positioned at or marginally beneath a long-term macro trendline that has provided support since 2017. He further highlighted that XRP began June trading just under the 50-month exponential moving average (EMA) — a configuration that has historically coincided with market bottoms, including instances in 2020, 2023, and 2024.
“If XRP successfully reclaims the 50 EMA and the Macro trend line, this configuration could represent one of the most significant bear traps of the current cycle,” Egrag Crypto stated.
Crypto analyst Patel shared his perspective on X, identifying what he believes is a second accumulation window following a 66% retracement. He identified the $1.10–$1.30 band as the present accumulation territory and suggested that should this support fail, the $0.65–$0.85 range could offer what he termed a “generational entry.” His long-term projections target $5, $10, and $15, drawing parallels to a prior accumulation phase that preceded an 835% surge.

On-Chain Metrics Fail to Support Price
Despite certain encouraging blockchain indicators, XRP’s valuation has continued its descent. Over 25 million XRP tokens departed exchanges in recent sessions, a development that generally diminishes selling pressure. Binance deposits also declined to their lowest point in 2026. Digital asset investment vehicles experienced approximately $1.42 billion in inflows through spot ETFs during this timeframe.
Yet none of these factors prevented the price erosion. When favorable supply dynamics fail to generate upward momentum, it frequently indicates that technical selling dominates market behavior.
Critical Price Levels Under Surveillance
Market participants are now concentrating on the $1.20–$1.21 territory as the most significant support structure on technical charts. A decisive break beneath this zone would likely clear the path toward $1.13–$1.15.
Analyst Kamile Uray identified the critical support band at $1.26–$1.30, cautioning that losing this region could precipitate a more substantial retracement toward $0.94–$1.11.
ChartNerd, another technical analyst, highlighted a potential bottom formation zone between $0.70 and $0.90, drawing from historical fractal analysis.
June has consistently presented headwinds for XRP performance. Since 2014, the asset has concluded the month with negative returns in eight of twelve instances, posting average losses around -5%. In years when XRP finished May in negative territory, June declines intensified. The most severe June contractions occurred in 2018 (-23.8%), 2021 (-34.4%), and 2022 (-21.5%).
XRP was last quoted near the $1.20 level, with market observers monitoring whether buyers can defend this zone heading into the weekly close.
Get 3 Free Stock Ebooks
Discover top-performing stocks in AI, Crypto, and Technology with expert analysis.
- Top 10 AI Stocks - Leading AI companies
- Top 10 Crypto Stocks - Blockchain leaders
- Top 10 Tech Stocks - Tech giants

