
 Faces Mounting Pressure as Binance Holdings Surge to Quarterly Peak")
Key Takeaways
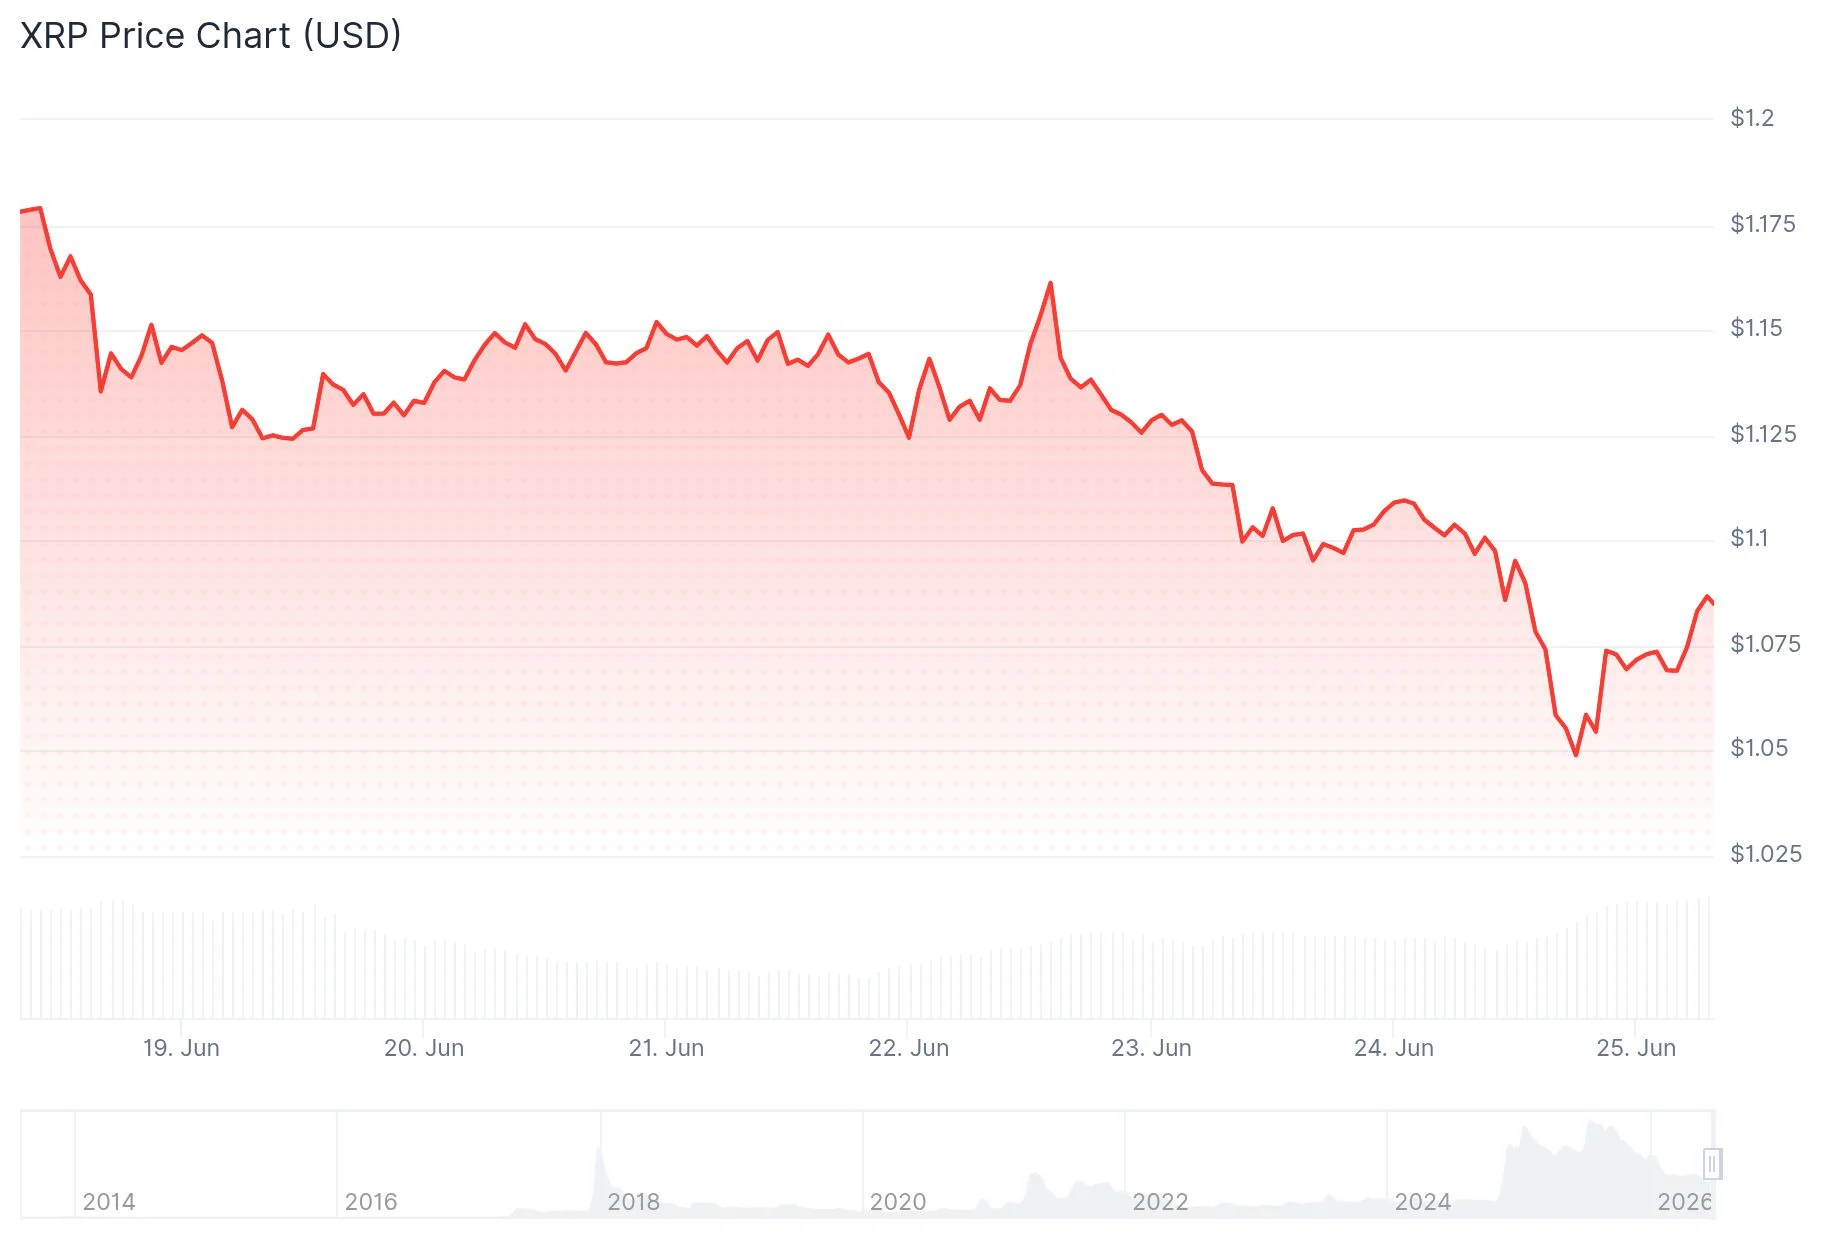
- XRP declined to approximately $1.057, representing a decline exceeding 15% from its June 16 high of roughly $1.29
- Binance’s XRP reserves climbed to their highest level in three months, causing the Scarcity Index to plunge to 0.34
- Technical charts reveal a falling wedge formation on the 4-hour timeframe, suggesting potential bullish reversal conditions
- Liquidation data from CoinGlass indicates a significant cluster around $1.14 that may act as a price magnet
- Over the past day, $13.53 million worth of XRP futures positions were liquidated, with leveraged longs comprising 96% of losses
Since reaching its recent peak near $1.29 on June 16, XRP has experienced persistent downward momentum. As of June 24, the digital asset was changing hands around $1.057, marking a depreciation of more than 15% within approximately eight days.
The downturn followed closely after Ripple obtained preliminary regulatory clearance under the European Union’s Markets in Crypto-Assets (MiCA) regulatory framework via Luxembourg authorities. While this authorization provides passporting privileges throughout the European Economic Area, market participants opted to secure gains rather than drive further appreciation.
Bitcoin’s weakness compounded the challenges. The flagship cryptocurrency temporarily dipped beneath $62,000 during this timeframe, creating negative sentiment ripples across the entire digital currency ecosystem. Persistent elevated borrowing costs combined with capital migration toward artificial intelligence and chip manufacturer equities have constrained speculative investment into cryptocurrency markets throughout Q2.
Prominent crypto analyst Altcoin Sherpa shared perspective on X, noting that the chart structure appears unfavorable across multiple timeframes and suggesting XRP might gradually decline toward $0.75. Such pessimistic commentary from an influential market observer captures the prevailing cautious sentiment.
Wedge Formation Maintains Bullish Reversal Potential
Examining the 4-hour timeframe reveals XRP developing a falling wedge configuration following the June 16 peak. This technical structure consists of two downward-sloping converging trendlines and frequently signals bullish breakouts when selling exhaustion occurs.

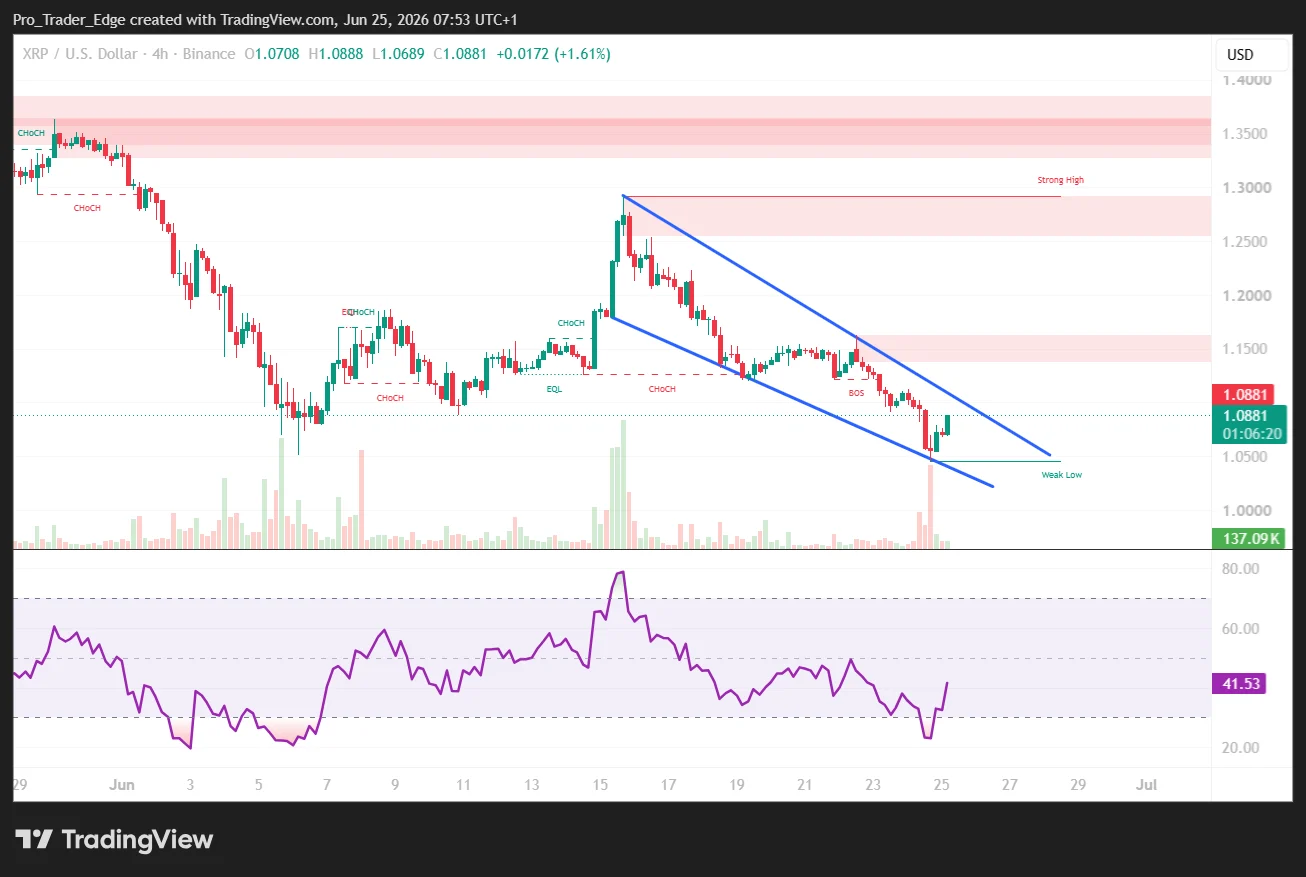
The token has touched the wedge’s lower boundary around $1.08, which coincides with a Fibonacci retracement support area. An upward breach through the upper trendline would expose resistance zones at $1.13, $1.16, and $1.19.
Technical momentum signals present a conflicting picture. The 4-hour MACD indicator persists below the zero line, confirming that sellers maintain near-term dominance. Nevertheless, the histogram bars have begun consolidating, hinting that downside force may be diminishing. The Chaikin Money Flow indicator registers approximately -0.13, reflecting ongoing capital outflows from the asset.
On daily charts, XRP continues trading beneath Supertrend resistance positioned near $1.24 and within a pattern of descending peaks since mid-May. The daily Relative Strength Index hovers around 36, nearing oversold conditions without fully entering that territory.
Exchange Inventory Expands While Scarcity Metric Plummets
A recent Cryptoquant examination released on June 22 reveals the XRP Binance Scarcity Index collapsed to approximately 0.34, representing its weakest reading in over three months. This metric calculates available XRP inventory on Binance relative to trading activity.
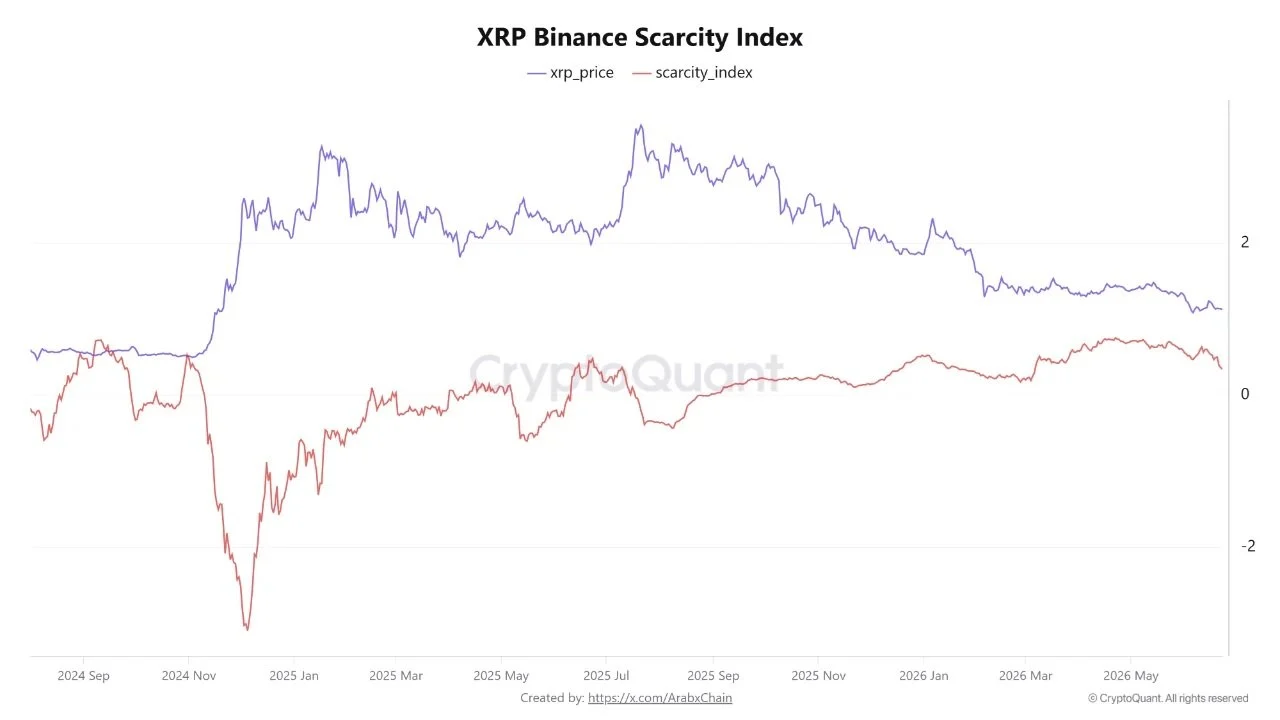
Throughout April and May, this index maintained levels near 0.80, indicating restricted supply conditions. The descent to 0.34 signifies substantially increased XRP availability on the platform, which typically constrains upward price movement absent corresponding demand surges.
CoinGlass analytics highlight a substantial liquidation concentration between $1.13 and $1.15. Should purchasing interest materialize at present support levels, this zone could generate upward price attraction and trigger short position liquidations. During the preceding 24-hour period, $13.53 million in XRP derivative contracts were liquidated, with long positions accounting for $13.01 million, representing 96% of total liquidations. Binance dominated with $7.59 million in forced closures, while Bybit recorded $2.57 million.
A breakdown beneath $1.08 would shift focus toward $1.05 and subsequently $1.00 as the next downside targets.
Get 3 Free Stock Ebooks
Discover top-performing stocks in AI, Crypto, and Technology with expert analysis.
- Top 10 AI Stocks - Leading AI companies
- Top 10 Crypto Stocks - Blockchain leaders
- Top 10 Tech Stocks - Tech giants

