


Key Highlights
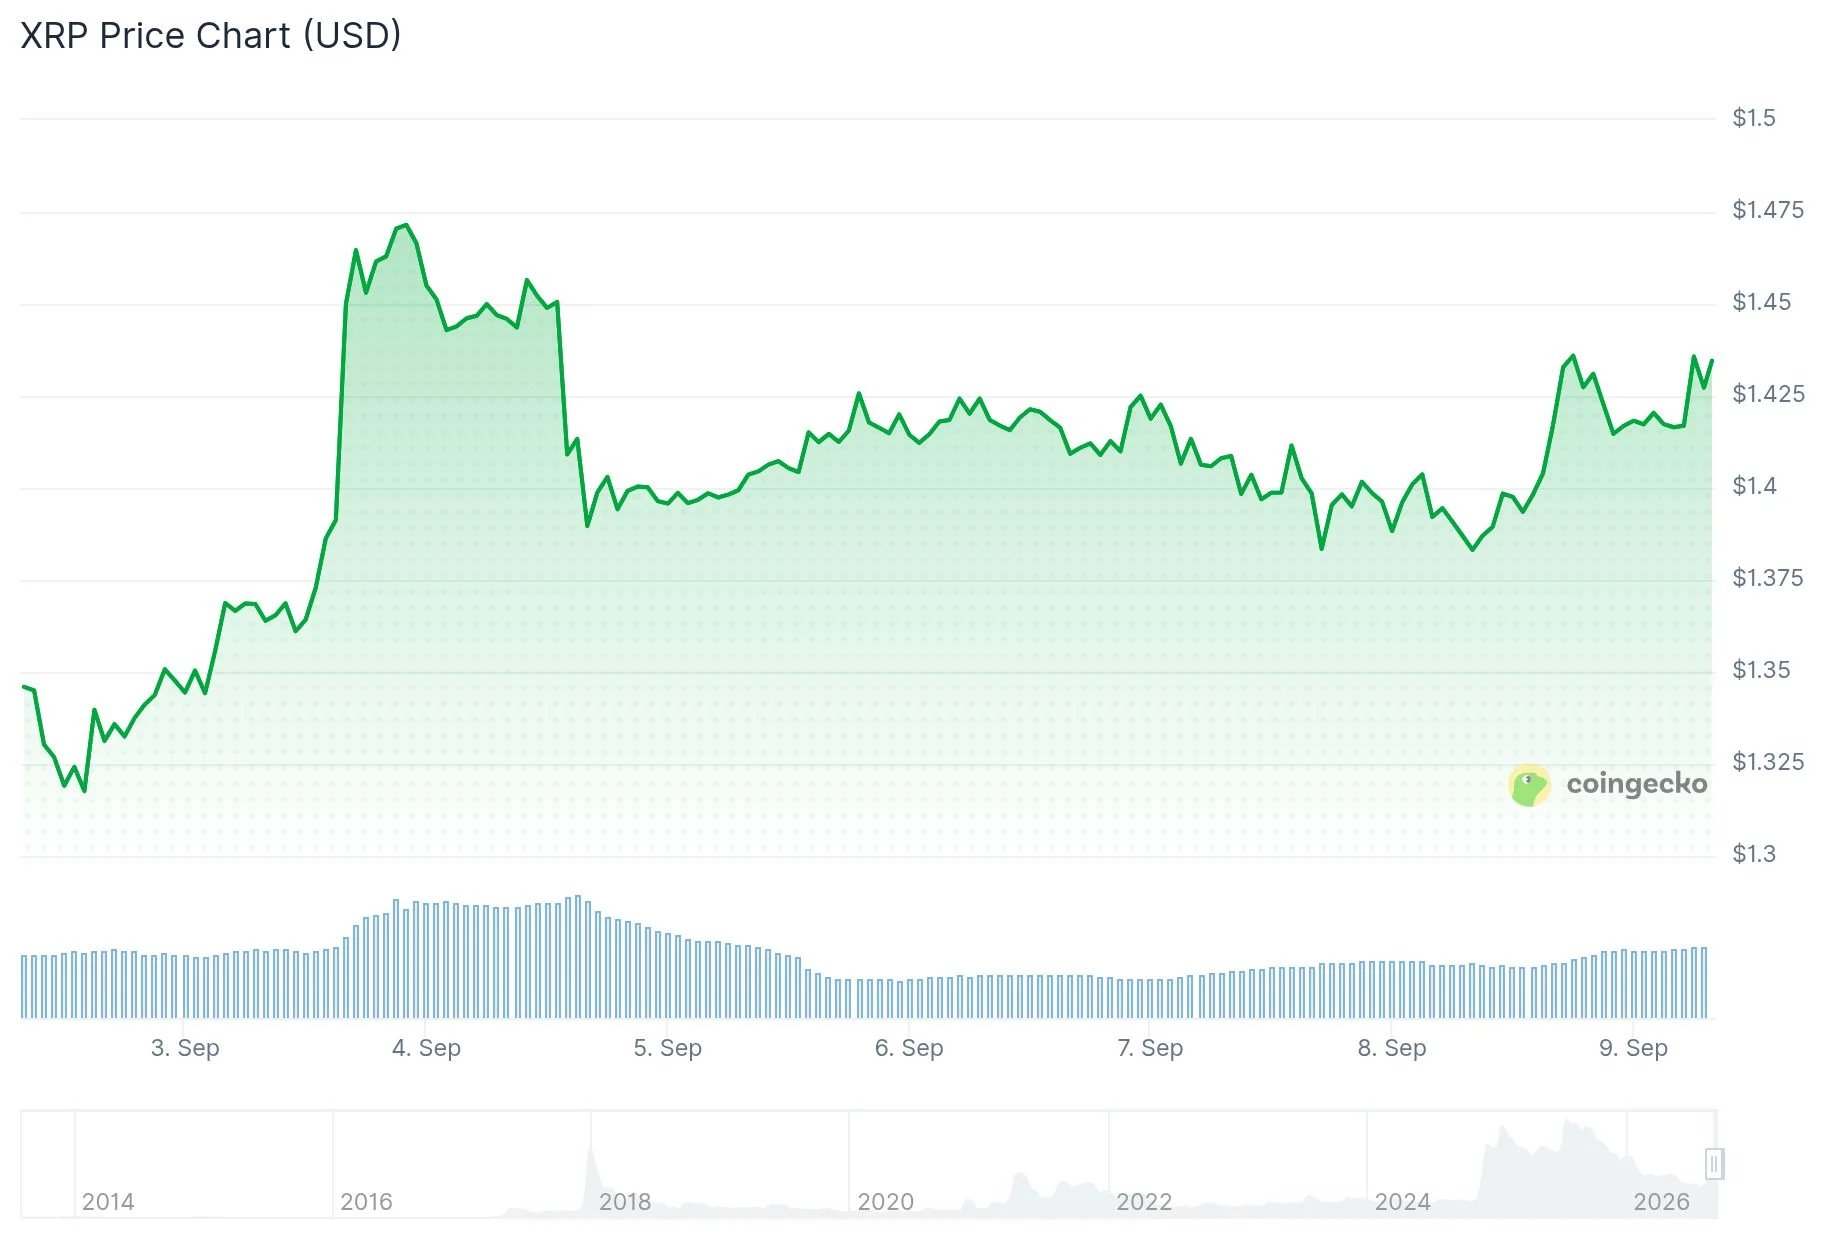
- XRP currently trades at $1.43, marking a 3.8% daily increase and 4.2% weekly gain
- Technical analyst Ali Charts monitors for a close above $1.40 to validate a potential move to $1.46
- Market observer Dark Defender identifies a bull flag formation targeting $1.8815
- Daily chart analysis reveals a bullish flag structure with potential for a 48% rally to $2.10
- XRP-focused ETFs recorded $13 million in cumulative inflows during early September
XRP has posted a 3.8% gain today, with the digital asset currently changing hands at $1.43. Over the seven-day period, the cryptocurrency has appreciated 4.2% as market participants observe the emergence of bullish technical formations near critical support zones.
This positive price action occurs against a backdrop of weakness in traditional markets. U.S. equities shed approximately $350 billion in market capitalization today as crude oil reached its highest level in three months.
Despite broader market headwinds, cryptocurrency market sentiment maintains a bullish stance. The Crypto Fear and Greed Index currently registers 72, indicating investors remain in “Greed” mode following a modest correction from the late-August surge.
Technical analyst Ali Charts has identified a descending triangle formation developing on XRP’s hourly timeframe. According to a recent X platform update, the analyst is monitoring for an hourly candle close above the $1.40 threshold, suggesting such a confirmation could catalyze a move toward $1.46.
Meanwhile, market technician Dark Defender has highlighted a bull flag configuration on XRP’s price chart. According to Dark Defender’s analysis, the pattern has already experienced a breakout and successful retest, establishing a subsequent price objective at $1.8815.

Bullish Flag Pattern Projects $2.10 Objective
Examining the daily timeframe, XRP has developed a textbook bullish flag formation in the wake of its robust late-August advance. This technical structure typically functions as a continuation pattern, suggesting the preceding uptrend may be poised to resume.
The flag component displays a downward slope, which market technicians interpret as consolidation driven by profit-taking among early position holders. Confirmation of this pattern would require a decisive break above the $1.50 region, representing the flag’s upper boundary.
Should such a breakout materialize, the measured move technique—calculated by projecting the flagpole’s height from the breakout point—yields a price target of $2.10. This objective represents a substantial 48% appreciation from present valuation levels.
Blockchain Metrics Suggest Significant Price Movement Ahead
Blockchain analytics from Santiment reveal that active address counts on the XRP Ledger experienced a notable surge in late August before declining. Historically, when the 7-day moving average crosses above or below the 30-day moving average for active addresses, substantial price volatility has followed in either direction.
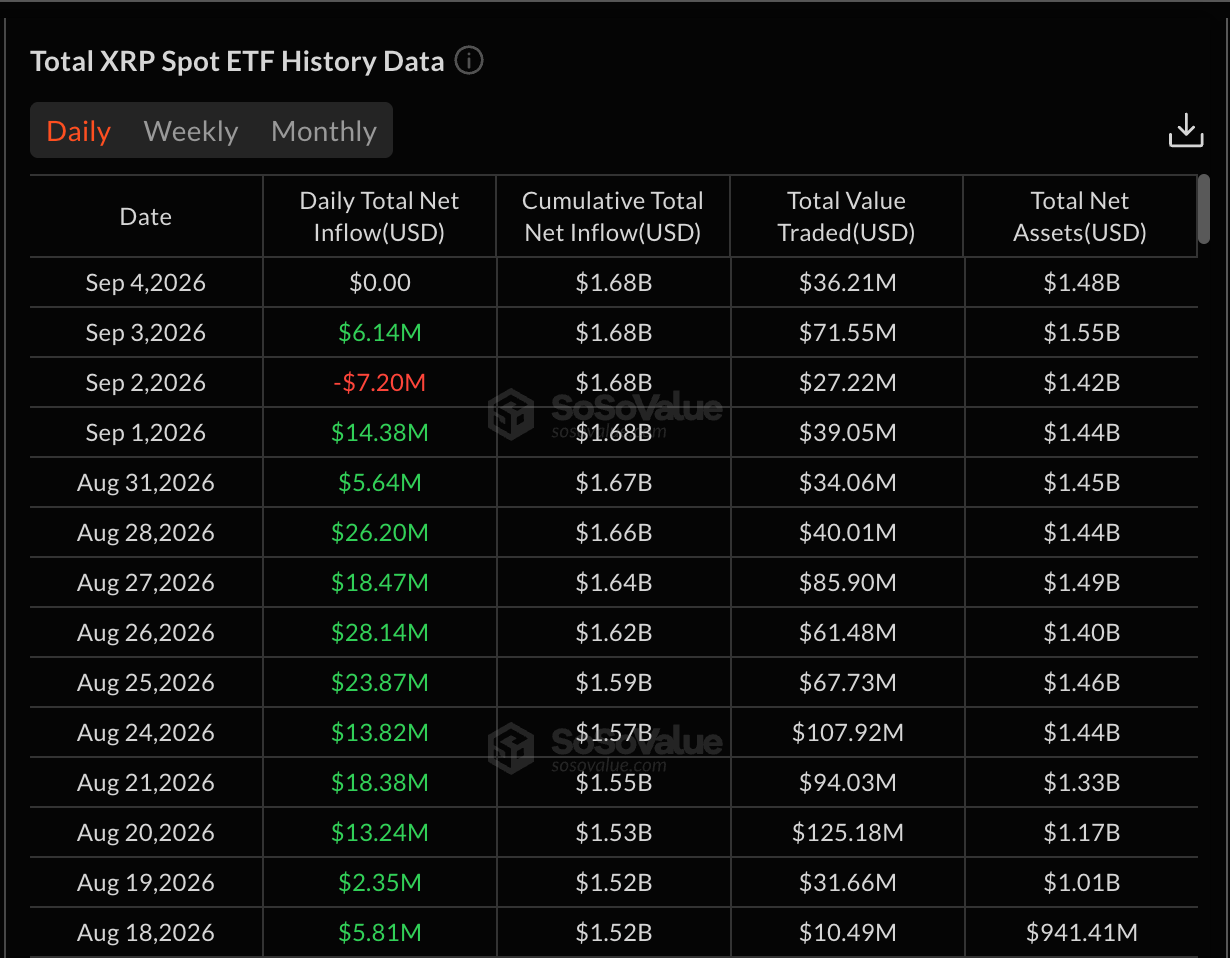
XRP exchange-traded fund products recorded $13 million in net positive flows at the beginning of September, translating to an average daily inflow of $3.3 million. Extrapolating this pace suggests monthly inflows could approach $60–$70 million, though this would represent a decline exceeding 50% compared to the previous month’s performance.
Ripple’s Chief Executive Brad Garlinghouse remains actively advocating for passage of the CLARITY Act, legislation designed to establish comprehensive regulatory frameworks for digital assets. Market participants are also focused on the Federal Reserve’s upcoming monetary policy announcement scheduled for September 16th, with current probability models indicating a 60% likelihood of a rate adjustment.
The earlier price forecast of $1.80 for XRP continues to serve as a relevant intermediate target, with the $1.50 resistance level representing the critical breakout zone for near-term price trajectory determination.
Get 3 Free Stock Ebooks
Discover top-performing stocks in AI, Crypto, and Technology with expert analysis.
- Top 10 AI Stocks - Leading AI companies
- Top 10 Crypto Stocks - Blockchain leaders
- Top 10 Tech Stocks - Tech giants


