



TLDR
- BTC currently hovers around $73,800, posting approximately a 3% decline across the last seven days.
- Trading expert Michael van de Poppe identifies $71K as a critical support threshold; defending it could propel BTC toward $76,600.
- Bitcoin spot ETFs have experienced a 10-day consecutive outflow streak, accumulating more than $2.97 billion in redemptions starting May 15.
- Economic analyst Timothy Peterson anticipates Bitcoin may inch upward through summer months but potentially reach a ceiling by late July.
- Technical analyst Ali Charts identified a TD Sequential buy indicator on Bitcoin’s chart, hinting at a possible climb toward $75,000.
Bitcoin is currently positioned near the $73,800 mark following a descent to approximately $72,000 earlier in the week—a seven-week trough. This pullback materialized as escalating geopolitical friction between the United States and Iran dampened investor risk tolerance. The leading digital asset has shed roughly 3% in value over the preceding week.
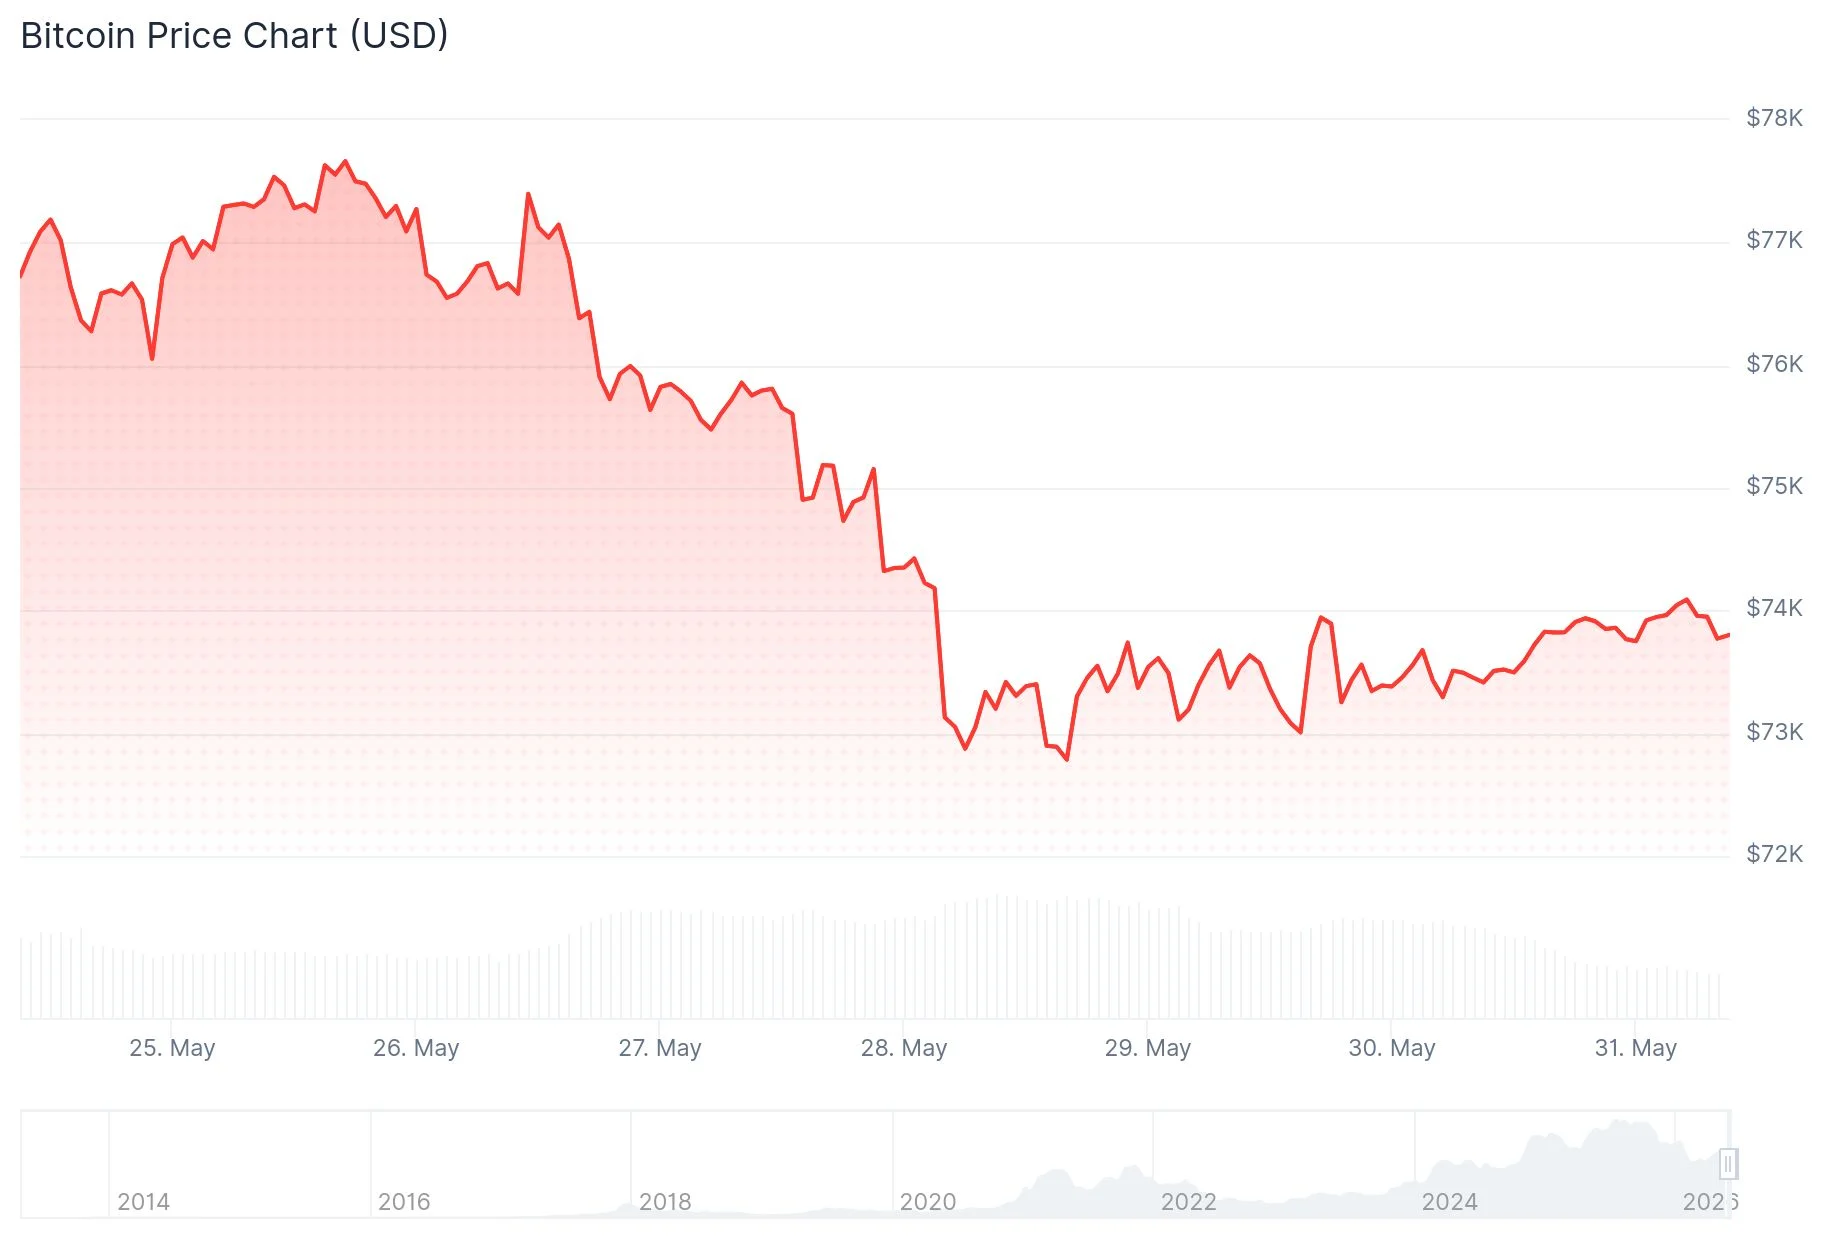
While the cryptocurrency has rebounded from its yearly bottom of $60,000 established in early February, uncertainty persists regarding whether that floor represents the cycle’s true bottom or merely a temporary consolidation before further declines.
Michael van de Poppe, who heads MN Trading Capital, characterized Bitcoin’s current position as a “pivotal level.” According to his analysis, failure to maintain the $71,000 threshold as solid support could send the cryptocurrency tumbling toward sub-$65,000 territory. Nevertheless, he emphasized that this configuration differs markedly from February’s breakdown scenario.
Van de Poppe further noted that successful defense of current price levels could catalyze a breakthrough toward $76,600. Such a development, he suggested, would probably ignite a broader rally across alternative cryptocurrencies.
ETF Outflows Signal Market Pressure
Bitcoin spot exchange-traded funds have now registered continuous outflows spanning ten consecutive trading sessions. Aggregate net withdrawals have surpassed $2.97 billion beginning May 15. During this identical timeframe, total ETF holdings have contracted from $104.29 billion down to $94.17 billion.

Digital asset analytics platform Santiment Intelligence observed that persistent ETF redemptions might indicate the market floor is approaching.
Technical analyst Ali Charts shared on X platform that Bitcoin has just activated a TD Sequential buy indication, commenting: “I think a rebound toward $75,000 could be in the cards.”
Trader Daan Crypto Trades similarly highlighted on X that bullish participants must recapture the $74,200 threshold, while $72,700 represents the crucial downside boundary that needs protection.
Bearish Case Still on the Table
Not all market observers believe a definitive bottom has formed. Seasoned trader Peter Brandt indicated in March that $60,000 might not represent the year’s actual low point, projecting Bitcoin could revisit or marginally breach that threshold come September or October.
CryptoQuant’s CEO Ki Young Ju cautioned that Bitcoin’s ongoing downward trajectory might extend into early 2027. He referenced historical patterns showing profit-taking cycles commonly produce approximately 18 months of subdued performance before meaningful recovery emerges. According to his assessment, the bearish phase commenced in October 2025 as market participants secured profits from the preceding uptrend.
Economist Timothy Peterson projected Bitcoin may gradually appreciate throughout summer, though he characterized potential gains as “relatively lackluster” and suggested prices might crest during July’s final week.
CryptoQuant’s Bull-Bear Cycle Indicator transitioned to positive territory earlier this month for the first occasion since 2023. Bitcoin presently maintains position marginally above the $72,700 support zone that analyst Daan Crypto Trades designated as essential for monitoring.
Get 3 Free Stock Ebooks
Discover top-performing stocks in AI, Crypto, and Technology with expert analysis.
- Top 10 AI Stocks - Leading AI companies
- Top 10 Crypto Stocks - Blockchain leaders
- Top 10 Tech Stocks - Tech giants


