
 Reclaims $64K Amid Switzerland Diplomacy — Critical Levels Ahead")
Key Takeaways
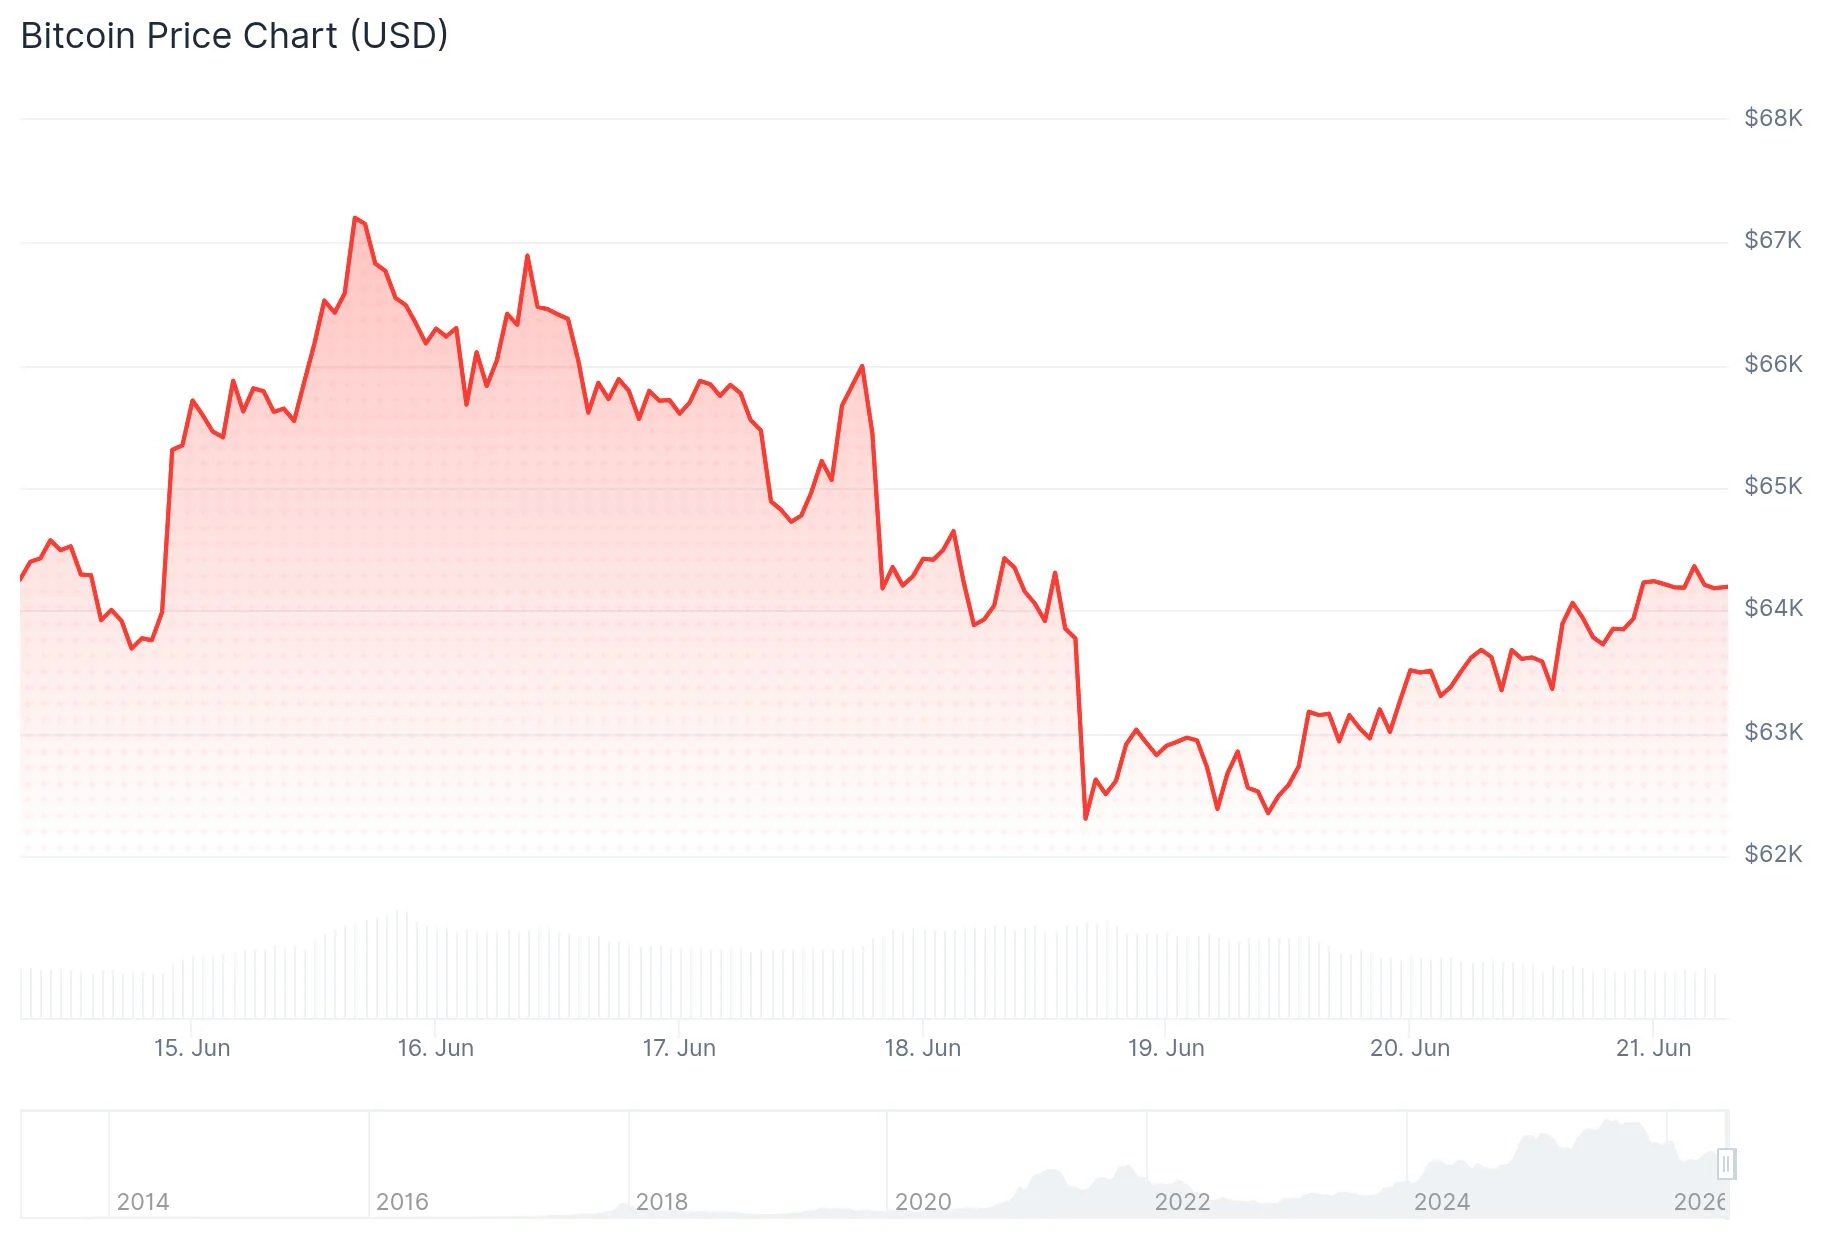
- BTC surged past $64,000 on Saturday, June 20, reversing recent losses
- The rally coincided with Vice President JD Vance’s announcement of travel to Switzerland for diplomatic negotiations with Iran
- Bitcoin maintains position above the 200-week simple moving average, signaling potential strength
- Technical analyst SuperBro identifies similarities between current price action and the 2015 market bottom
- Critical resistance zone identified at $63,800–$64,000, with primary support level at $61,650
Bitcoin surged back above the $64,000 threshold on Saturday, June 20, following announcements that US Vice President JD Vance would head to Switzerland to participate in diplomatic discussions with Iranian officials. At press time, BTC was changing hands at $64,107, representing a daily gain of 1.63%.
In a Fox News interview, Vance indicated he would depart “sometime the next couple of days” to join US representatives Jared Kushner and Steve Witkoff, who had already arrived in Switzerland. Reports suggest Qatar and Pakistan are facilitating the diplomatic efforts.
The price recovery follows a period of market hesitation. Initial reports indicated the negotiations had hit roadblocks, with a scheduled Friday meeting being delayed. Nevertheless, major news organizations including CNN and Axios verified that Witkoff was traveling to Switzerland to restart the dialogue.
Cryptocurrency market analyst Daan Crypto Trades highlighted on X that Bitcoin was rebounding from both the Weekly 200-day moving average and the 0.618 Fibonacci retracement zone. According to his analysis, maintaining the approximate $62K level through the weekly close is essential for bulls, as breaking below this threshold would signal short-term weakness. He suggested that breaking above the local peak near $67K could propel prices toward $73K.
Technical Analysis: Parallels to 2015 Bottom
On June 19, market analyst SuperBro drew attention to striking similarities between Bitcoin’s present chart structure and the bottom formation witnessed in 2015. Currently, BTC trades approximately 5% above its February trough while holding above the 200-week SMA.

SuperBro identified multiple technical indicators supporting a potential reversal: a bullish 10/20 SMA weekly crossover has occurred, Stochastic RSI has climbed above 99, RSI has advanced from sub-30 levels to above 45, and six consecutive weeks of higher lows have formed. The current retracement measures less than 2% from the previous low, echoing 2015 market dynamics.
However, he emphasized that the 200-week SMA represents the decisive battleground. Maintaining support above this level keeps reversal prospects alive, while losing it would significantly complicate recovery efforts.
Critical Price Zones Under Surveillance
Analyst EliZ provided a clear framework for Bitcoin’s immediate price range. The resistance zone is positioned at $63,800–$64,000, while support rests at $61,650. According to his assessment, no compelling trading opportunity exists at current levels, with the next significant price movement dependent on which boundary breaks first.
He also presented an alternative scenario involving a decline to the lower support area, a liquidity sweep operation, followed by potential recovery if purchasing demand materializes.
As of this writing, BTC was trading at $63,552 with 24-hour trading volume reaching $27.59 billion and a market capitalization of $1.27 trillion, reflecting a 24-hour increase of 1.69%.
Get 3 Free Stock Ebooks
Discover top-performing stocks in AI, Crypto, and Technology with expert analysis.
- Top 10 AI Stocks - Leading AI companies
- Top 10 Crypto Stocks - Blockchain leaders
- Top 10 Tech Stocks - Tech giants

