
 Surges Past $63K as On-Chain Metrics Signal Potential Market Bottom")
Key Takeaways
- BTC surged past $63,000 for the first time in two weeks, posting a 1.4% gain over 24 hours
- The realized profit and loss ratio plummeted to -0.35, marking its lowest point in 43 months
- XRP emerged as the top performer, surging 5.3% to $1.18 and flipping USDC by market capitalization
- Industry analysts suggest the market bottom may be forming, with potential for a fresh bull cycle this autumn
- Positive macro developments, including Fed commentary on cooling inflation and weak employment data, supported the rally
Bitcoin pushed above the $63,000 threshold on Independence Day weekend, erasing earlier losses from late June. This surge represents BTC’s strongest price point in a fortnight.
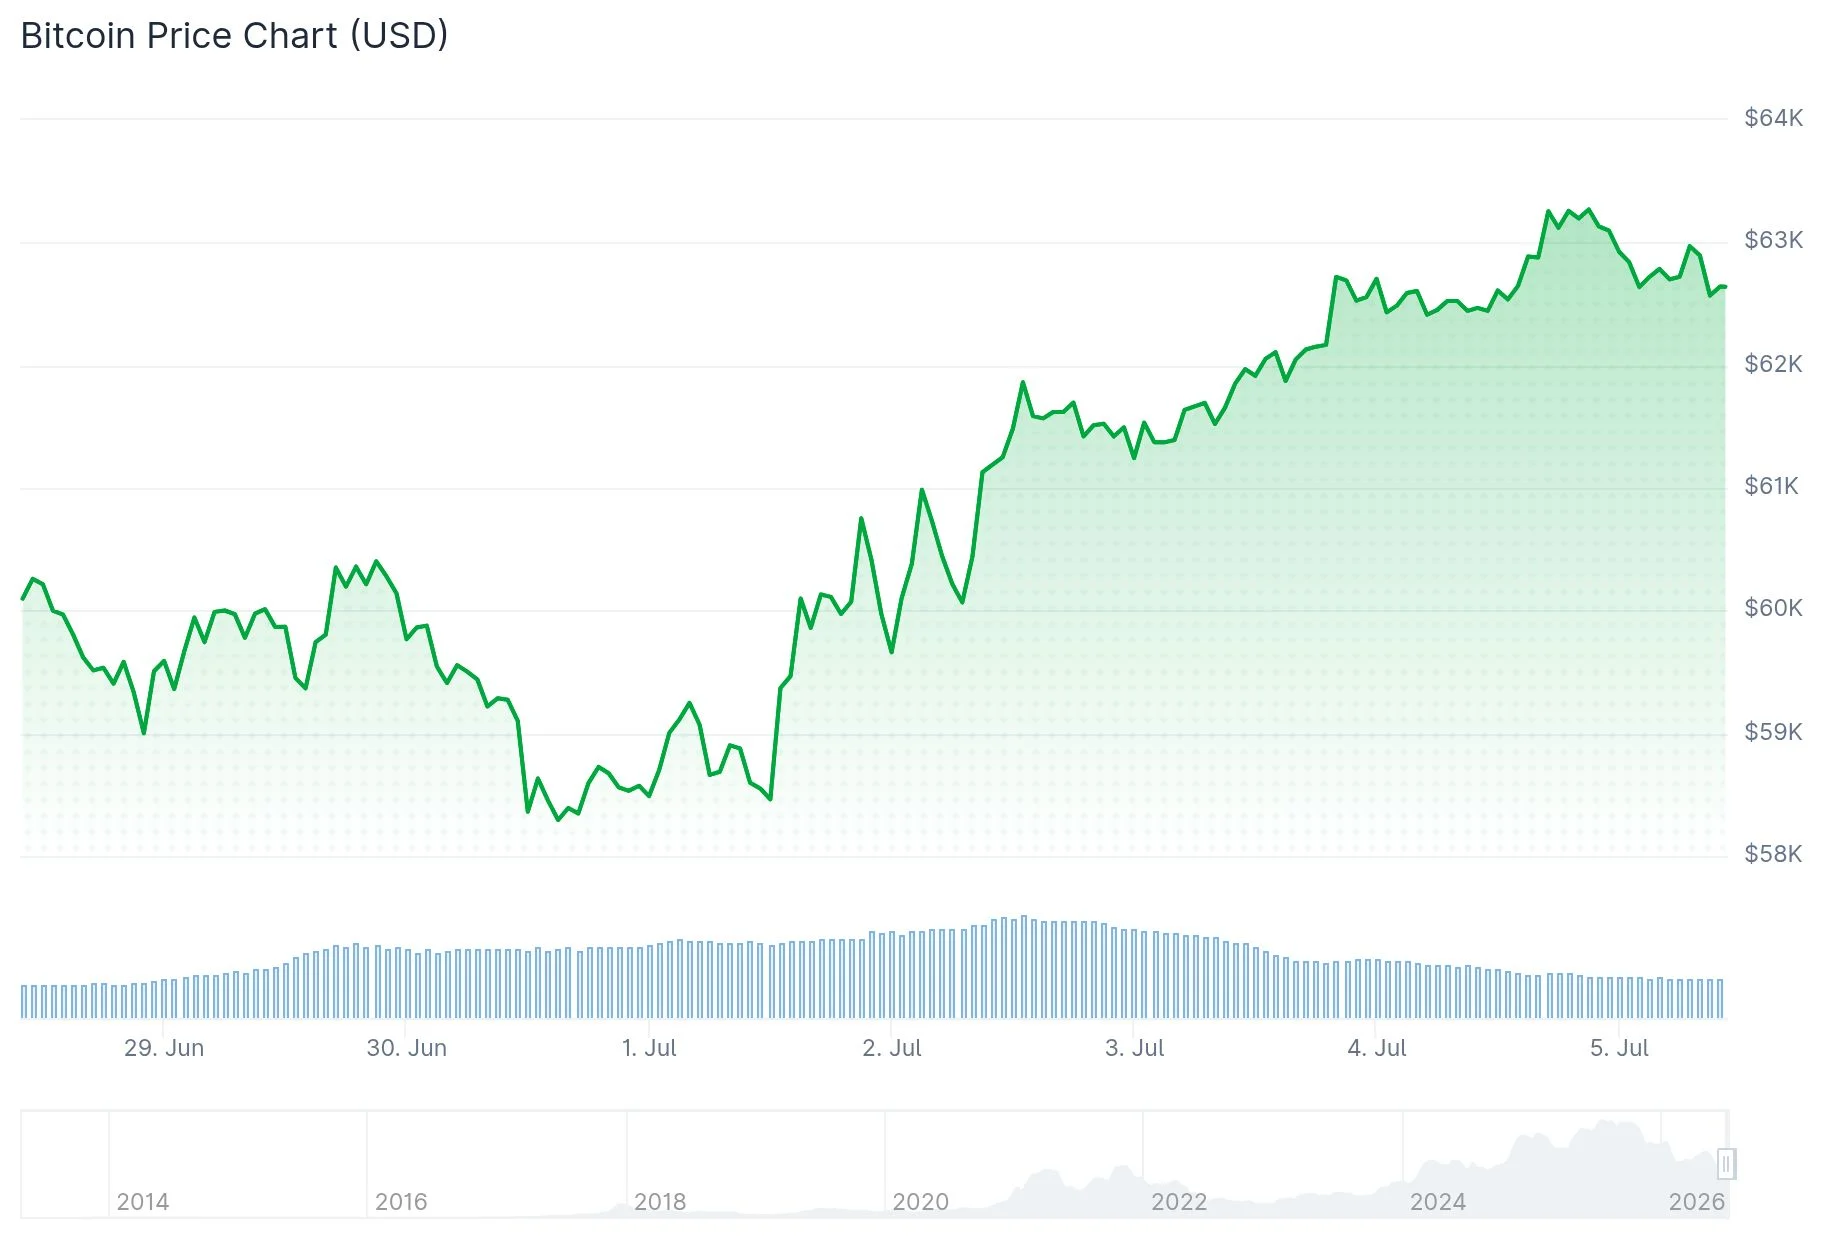
According to CoinDesk market data, Bitcoin appreciated 1.4% in the past day and climbed 3.6% across the weekly timeframe. The upward movement occurred during reduced trading volumes as American exchanges observed the July 4th holiday.
XRP delivered the most impressive performance among leading cryptocurrencies, jumping 5.3% to reach $1.18 with weekly gains approaching 10%. This price action enabled XRP to leapfrog USDC stablecoin, securing the fifth position by market capitalization at approximately $73 billion.
Ethereum posted a 3.2% daily increase to approximately $1,793, accumulating an 11.5% gain over the seven-day period. Solana maintained its position near $82.50 with a weekly surge of 13.2%, while Dogecoin added 2.6%.
Catalysts Behind the Price Movement
The weekly uptrend was fueled by improving macroeconomic conditions. Federal Reserve Chair Kevin Warsh indicated that inflationary pressures have moderated. Disappointing June employment figures reinforced this narrative, while short position holders faced liquidations as prices climbed.

This confluence of factors propelled Bitcoin from sub-$60,000 levels to beyond $63,000 across five consecutive trading days.
Market analyst Ted Pillows highlighted on X that Bitcoin approached a critical resistance threshold. He emphasized that successfully breaching $62,800 could catalyze a move toward $65,000.
Santiment Intelligence provided additional perspective, observing that Bitcoin has climbed 6.1% from June 30, outpacing gold’s 4.8% advance while the S&P 500 remained stagnant. According to Santiment, market participants re-entered positions near crucial support zones following weeks of pessimism, ETF capital outflows, and bearish sentiment.
Blockchain Metrics Point to Bottom Formation
On-chain analytics provider CryptoQuant revealed that Bitcoin’s realized profit and loss ratio descended to -0.35, representing a 43-month nadir. This metric hasn’t registered such depressed levels since December 2022, when the FTX implosion drove Bitcoin below $16,000.
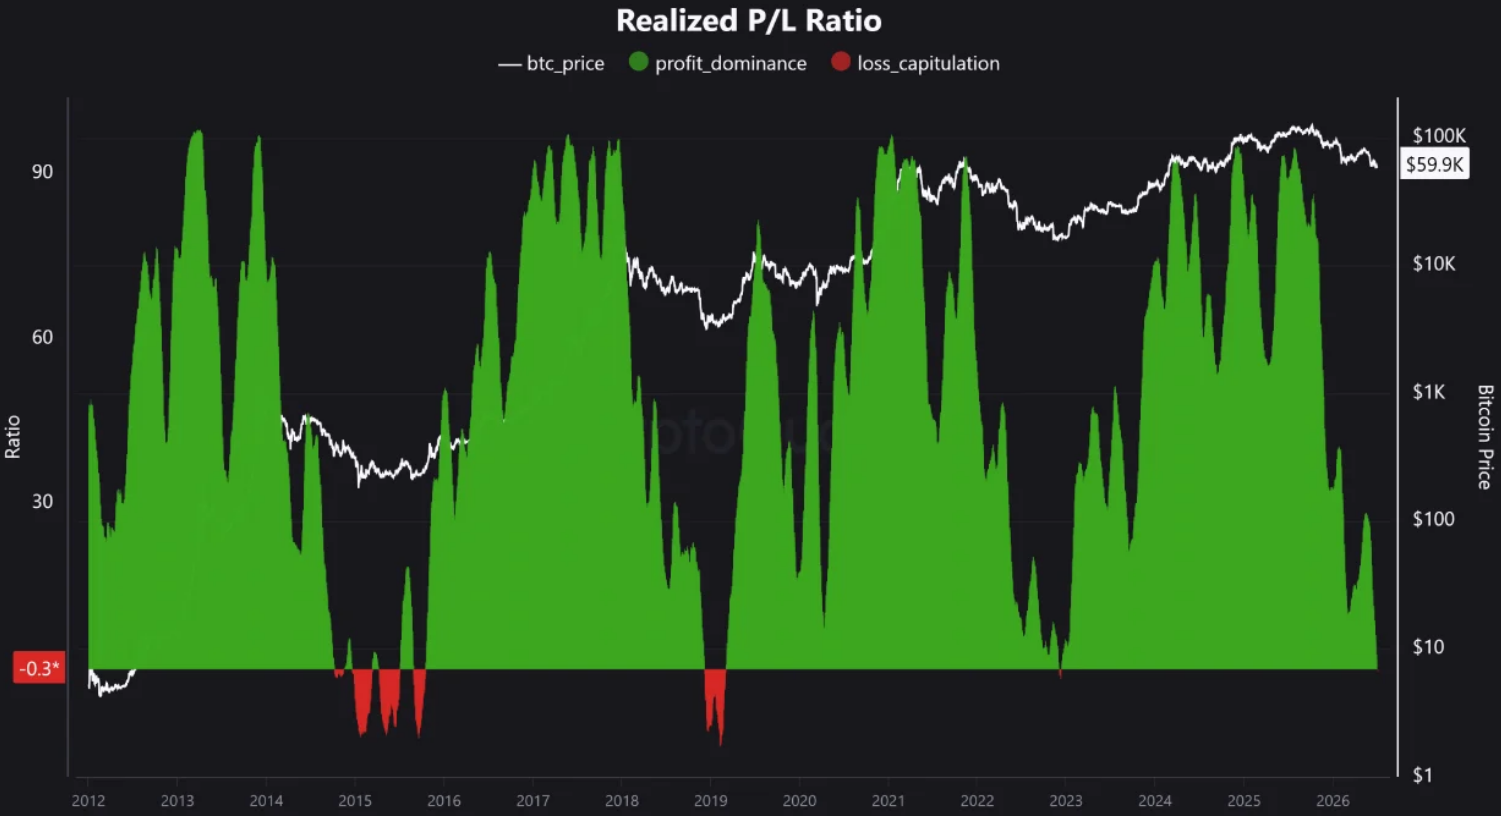
CryptoQuant emphasized that this indicator has consistently identified BTC price troughs throughout history. Comparable measurements emerged in 2015 and 2019, both preceding substantial rallies.
Bitwise Chief Investment Officer Matt Hougan stated that Strategy’s recent STRC preferred stock liquidation eliminated excessive leverage from the system and probably positioned the market nearer to a cyclical floor.
Swan Bitcoin analyst Adam Livingston highlighted that Bitcoin currently trades merely 16% above its realized price. Historical analysis demonstrates that this proximity has typically generated forward returns of 41% within six months and 81% over twelve months.
Bitcoin commenced the third quarter at 21-month lows following a 50% decline from its October peak of $126,080. The cryptocurrency touched a near two-year bottom of $58,190 on June 25 before initiating the present recovery phase.
Get 3 Free Stock Ebooks
Discover top-performing stocks in AI, Crypto, and Technology with expert analysis.
- Top 10 AI Stocks - Leading AI companies
- Top 10 Crypto Stocks - Blockchain leaders
- Top 10 Tech Stocks - Tech giants

