



Key Highlights
- SUI currently trades at $0.6761, experiencing a 0.25% decline over the past 24 hours with a $2.75 billion market capitalization
- Crypto analyst Michaël van de Poppe identifies the $0.65–$0.67 range as a strategic accumulation zone
- Van de Poppe’s upside target reaches $0.745 contingent on SUI maintaining its higher low at $0.6725
- The token trades 87.3% beneath its January 2025 all-time high of $5.35
- Downside pressure could intensify toward $0.65 if the $0.66844 support fails
As of August 17, 2026, Sui (SUI) maintains a price of $0.6761, positioned narrowly above a critical technical support threshold. The cryptocurrency has experienced an 87.3% correction from its peak value of $5.35, which was established in January 2025.
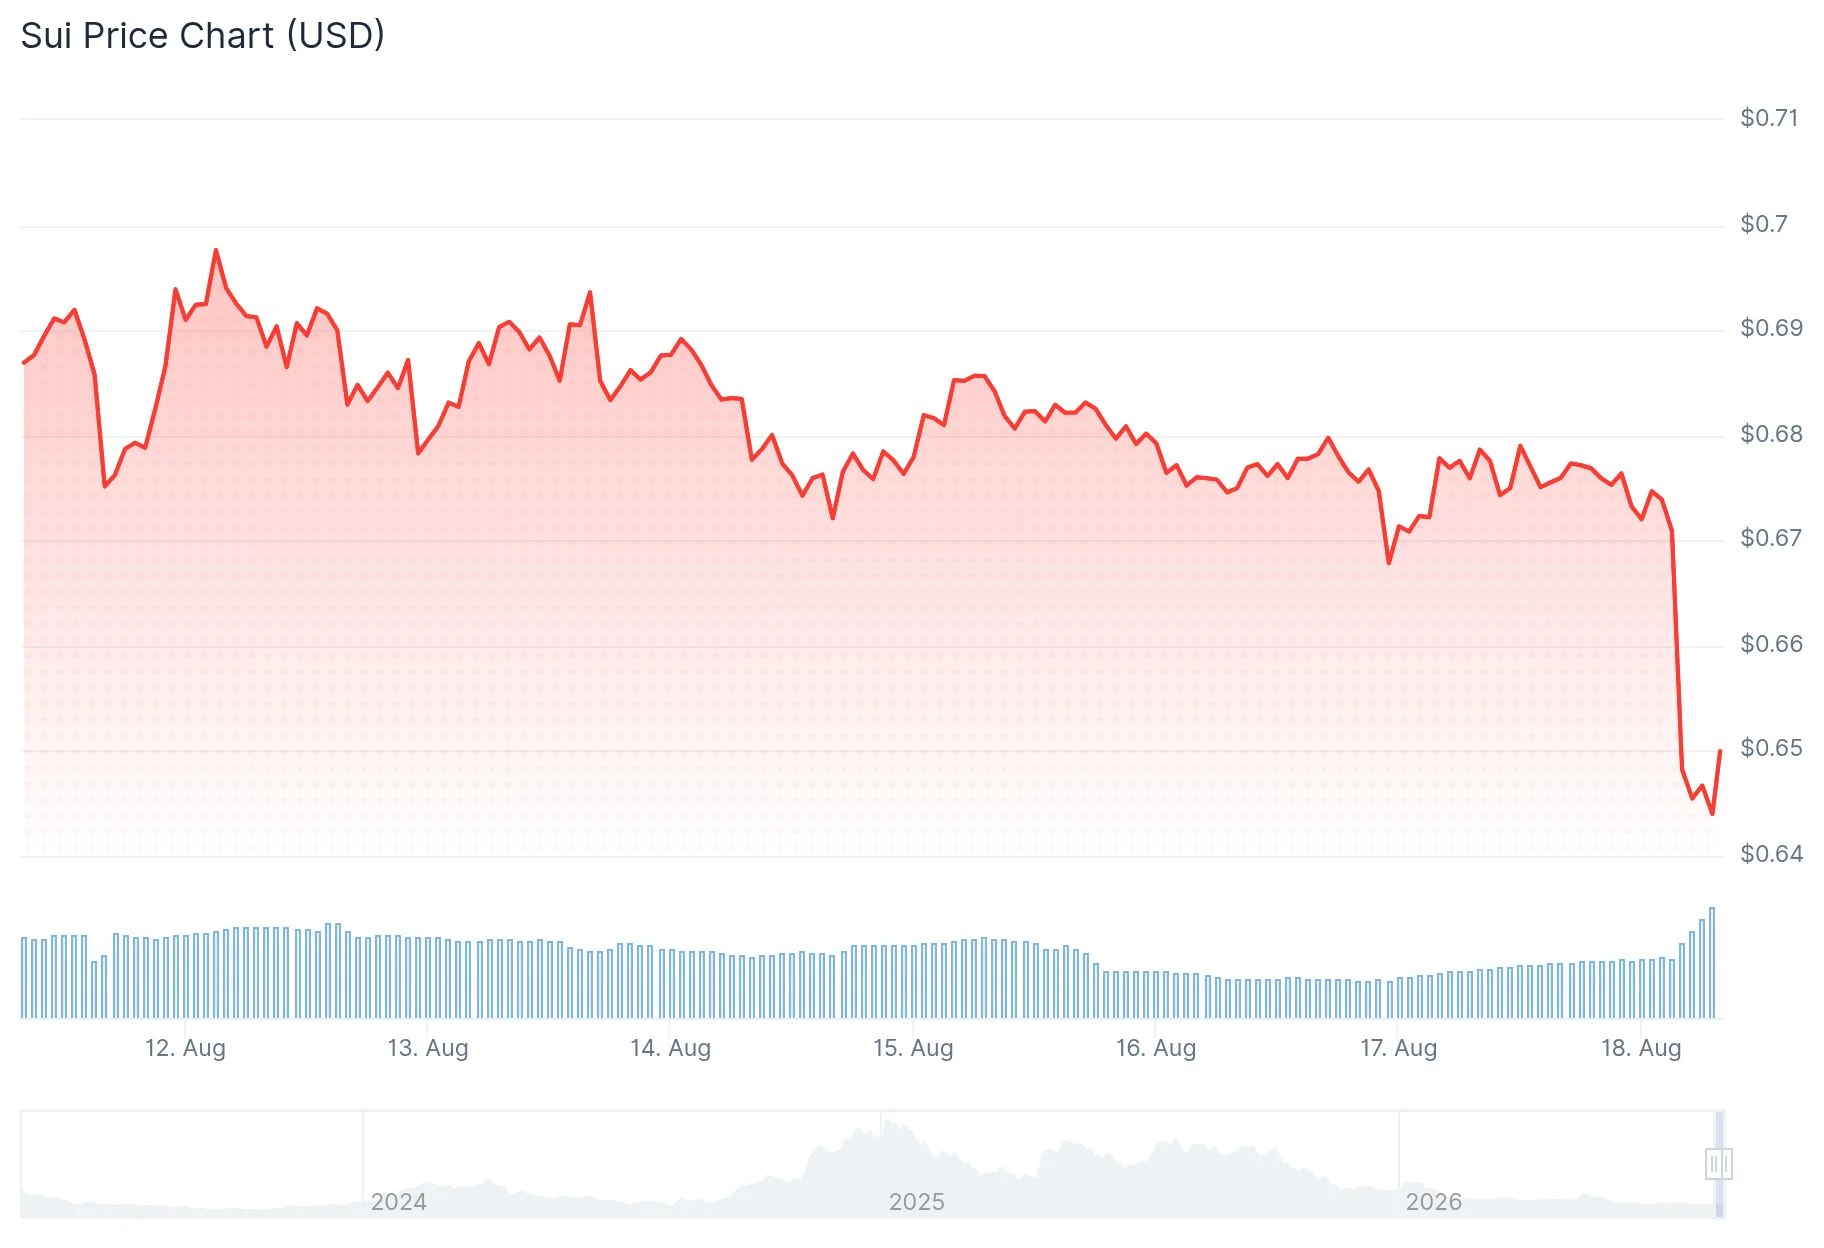
Trading activity over the previous 24 hours registered approximately $159.44 million in volume, while the token’s market capitalization stands near $2.75 billion. Since early June, SUI has remained confined within a $0.67–$0.77 consolidation pattern.
Cryptocurrency market analyst Michaël van de Poppe shared his perspective on X, characterizing SUI as representing “an ideal spot to be accumulated.” His analysis presented two distinct pathways for the asset’s upcoming price movement.
According to his primary scenario, the recent price decline establishes a higher low formation at $0.6725. Should this threshold prove resilient, he anticipates an accelerated upward move toward the $0.745 resistance zone.
His alternative scenario considers the possibility of Bitcoin experiencing weakness that drags down the broader cryptocurrency market. Under these conditions, van de Poppe indicated he would pursue SUI purchases below $0.65 for an extended swing trading position.

Technical Indicator Analysis
SUI presently trades beneath its middle Bollinger Band positioned at $0.68332, and remains near the lower band at $0.66844. The upper band is located at $0.69820.
The MACD histogram displays a marginally positive reading at 0.00079, while the MACD line registers -0.01098, positioned slightly above the signal line at -0.01177. This configuration suggests modest bullish momentum, despite both indicators remaining in negative territory.
On-Balance Volume (OBV) has demonstrated stagnation for more than 30 days, and the RSI continues struggling to breach the 50 threshold. The Stochastic RSI recently executed a bearish crossover pattern, potentially foreshadowing additional downward price action.
Critical Price Thresholds
The $0.833 level functions as a resistance zone and corresponds to the 23.6% Fibonacci retracement level. The golden pocket zone extends considerably higher, spanning from $1.12 to $1.25.
CoinGlass liquidation metrics reveal a concentration of long position liquidations beneath $0.65, establishing this region as a probable target for a liquidity sweep. On the upside, the $0.78 zone contains another liquidity accumulation that aligns with a local resistance area.
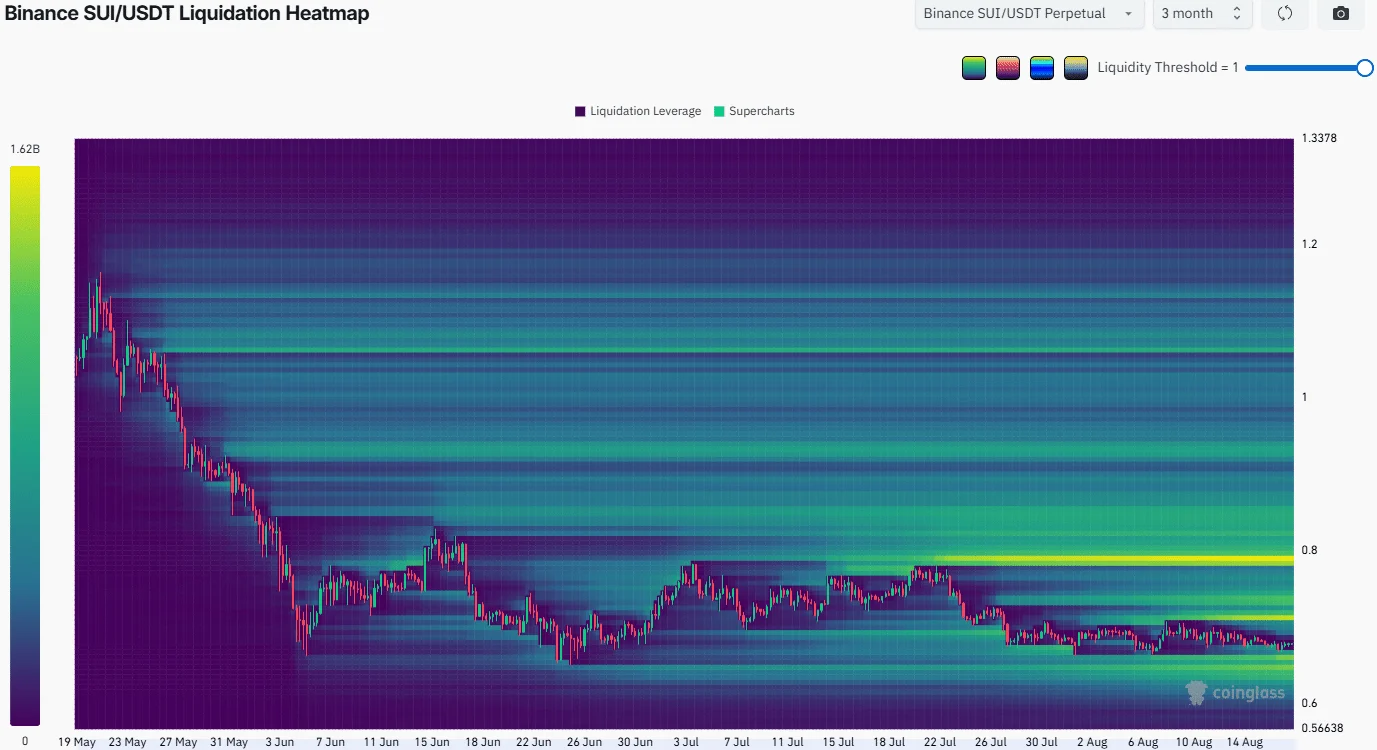
A rebound approaching $0.80 would likely present a favorable selling opportunity, whereas a decisive break below $0.64 would suggest continuation of the bearish trend.
During the period spanning February through early May 2026, SUI exhibited a comparable consolidation pattern before launching a substantial rally toward $1.42. That upward movement was subsequently followed by intense selling pressure in the following weeks.
For momentum to improve, SUI must successfully breach $0.68332, followed by $0.69820. The $0.745 resistance threshold highlighted by van de Poppe remains the immediate upside objective for traders.
Get 3 Free Stock Ebooks
Discover top-performing stocks in AI, Crypto, and Technology with expert analysis.
- Top 10 AI Stocks - Leading AI companies
- Top 10 Crypto Stocks - Blockchain leaders
- Top 10 Tech Stocks - Tech giants


