



Key Takeaways
- DOGE maintains position between $0.1014–$0.1026, sustaining critical $0.10 support level.
- Technical chart displays falling wedge configuration, potentially signaling bullish momentum shift ahead.
- Institutional appetite remains evident with $860,960 flowing into DOGE spot ETFs during the previous week.
- Critical resistance zone established at $0.1050; successful breach could propel price toward $0.1100 and subsequently $0.1150.
- Technical experts identify possible local bottom formation on weekly timeframe, with $0.0883 representing key downside threshold.
Dogecoin maintained its position above the psychologically important $0.10 threshold on Tuesday despite broader cryptocurrency market weakness. The meme token registered at $0.10259, declining 0.74% across the 24-hour period, while trading volume surged 31% to reach $719.25 million, demonstrating sustained market engagement.
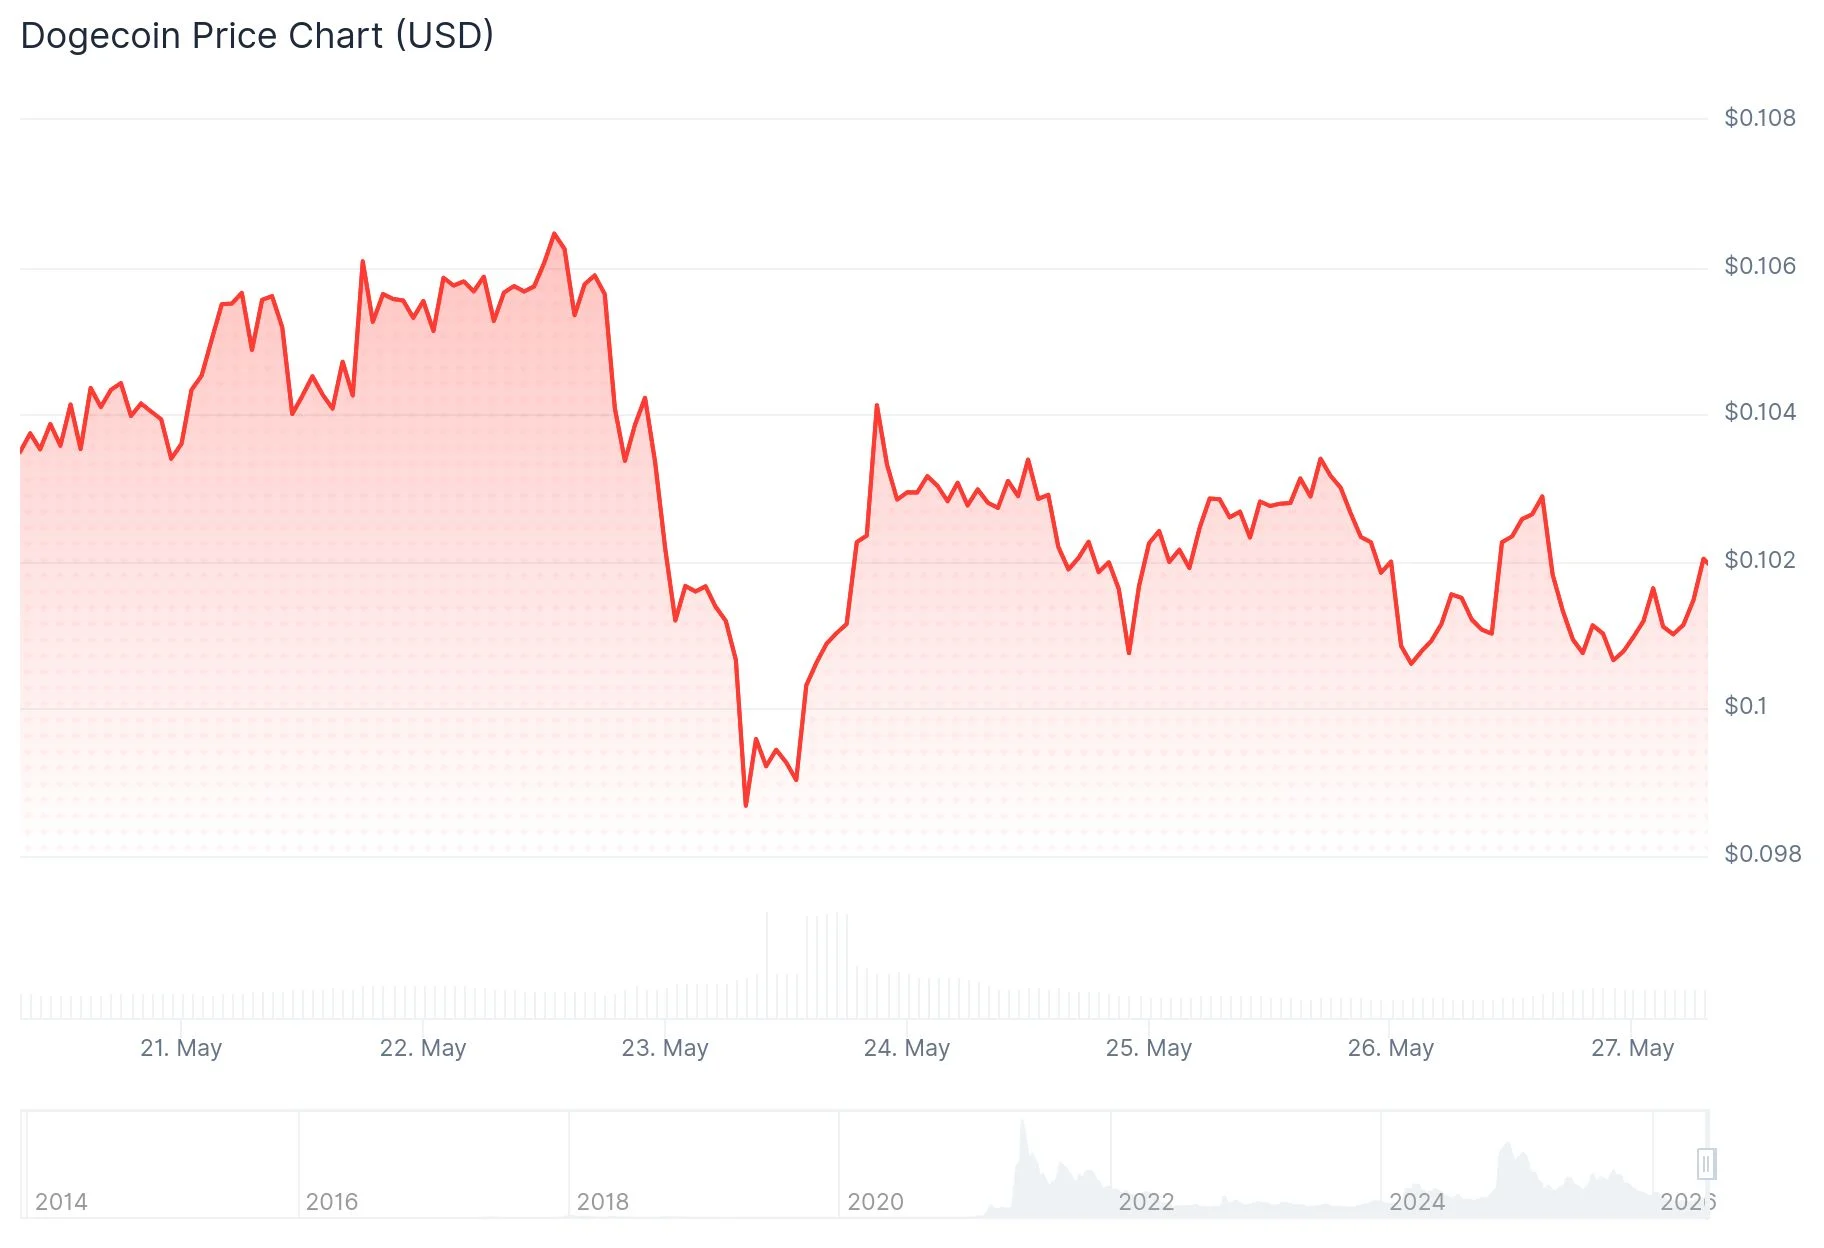
The cryptocurrency sector experienced a 1.33% contraction during this timeframe, reducing aggregate market capitalization to $2.56 trillion. Bitcoin retreated 1.01% to $76,866, creating downward pressure across alternative cryptocurrencies, including DOGE.
Market participants attributed the downturn to recent U.S. military operations targeting Iran, triggering a flight to safety among investors. Meme-based tokens experienced disproportionate selling pressure within this risk-averse climate.
Neverthstanding the price weakness, Dogecoin maintained appeal among institutional participants. Information from Sosovalue revealed DOGE spot ETFs accumulated net positive inflows for four consecutive weeks. The preceding week witnessed $860,960 entering these investment vehicles, confirming sustained appetite from sophisticated market participants.
Technical Formation Captures Market Focus
Cryptocurrency market analyst Trader Tardigrade identified DOGE’s price movement within a falling wedge configuration spanning multiple weeks. This technical structure features converging price boundaries as market forces compress, frequently preceding significant directional moves.

Historically, this chart pattern tends to resolve with upward price acceleration. Market participants are monitoring for a decisive penetration above wedge resistance, which would represent an initial indication of shifting market dynamics favoring DOGE.
Analyzing the 4-hour timeframe, price currently registers at $0.1014 with near-term resistance positioned at $0.1050. Surpassing this barrier would establish a trajectory toward $0.1100, with sustained buying interest potentially extending gains to $0.1150, a zone that previously provided resistance during early May.
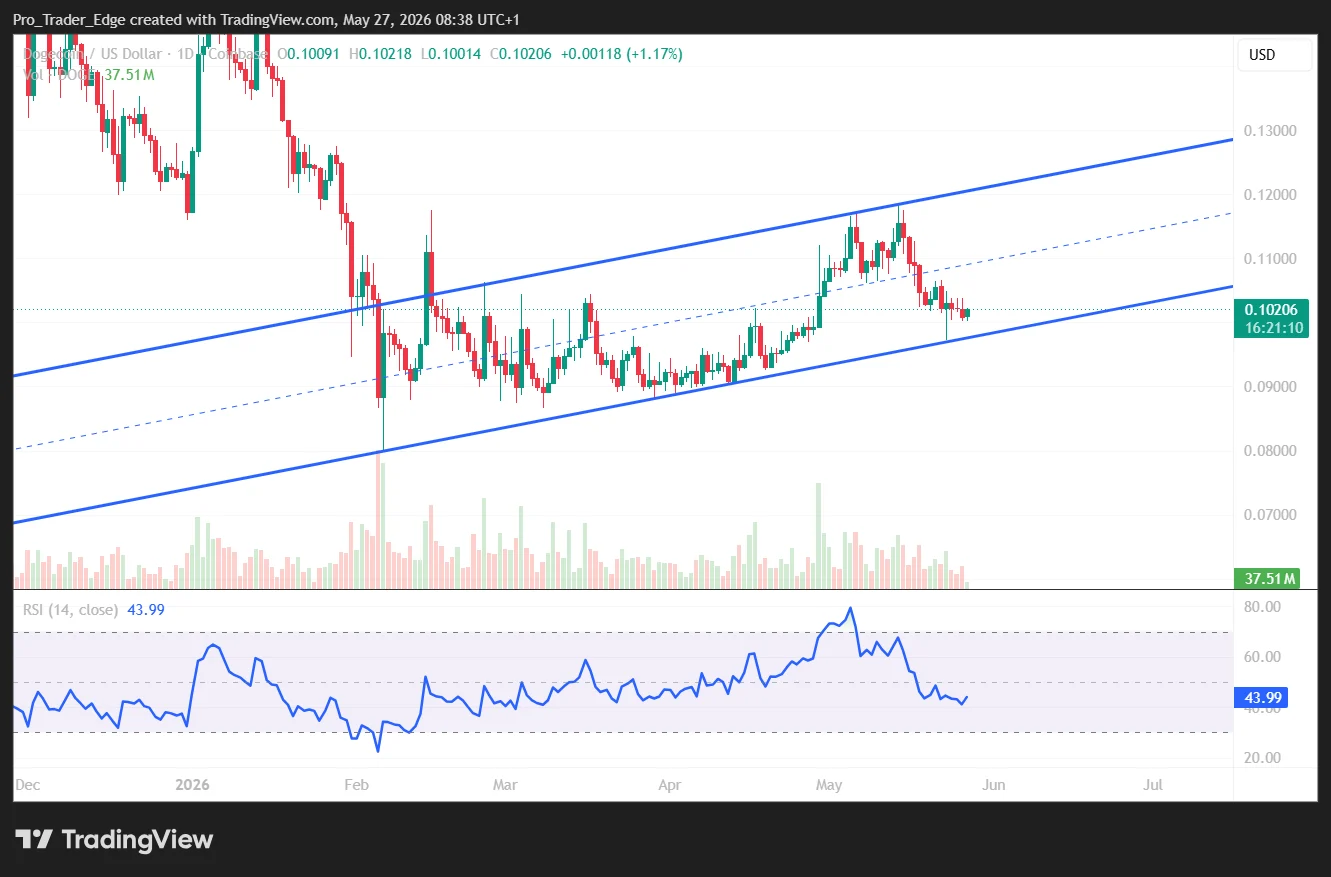
The Relative Strength Index currently measures approximately 44.50, indicating subdued momentum without reaching oversold territory. The MACD indicator displays marginal negative readings, though the histogram presents preliminary indications of potential reversal.
Critical Support Zones Under Surveillance
Examining the daily timeframe, market analyst Ali Charts identified the $0.1020–$0.1027 region as a pivotal support area. This zone coincides with the channel median and the 50-day simple moving average, enhancing its technical significance.
DOGE recently retreated from the upper boundary of its multi-week channel near $0.1156. This level now represents the primary upside objective should buyers successfully defend current support.
Should support fail, Ali Charts identified the lower channel boundary approaching $0.0883 as the subsequent downside destination.
On the weekly timeframe, analyst Moe detected a pattern resembling the 2024 bottom structure. DOGE has advanced above a declining trendline, with the current chart displaying a rounded base developing throughout 2026.
Moe identified the present zone as a probable local bottom. DOGE is currently testing three-month resistance, requiring a breakout above this band to validate a more substantial upward trajectory. Rejection from this area would maintain DOGE within its established trading range.
DOGE spot ETFs most recently registered $860,960 in weekly inflows across four consecutive positive weeks.
Get 3 Free Stock Ebooks
Discover top-performing stocks in AI, Crypto, and Technology with expert analysis.
- Top 10 AI Stocks - Leading AI companies
- Top 10 Crypto Stocks - Blockchain leaders
- Top 10 Tech Stocks - Tech giants


