



Key Highlights
- DOGE currently sits at $0.1031, experiencing modest weekly losses
- ETFs recorded positive inflows for the fourth week running, adding approximately $860,960 last week
- Open interest stands at $1.32B while derivatives trading volume declined 16.66%
- Technical analyst Ali Martinez identifies $0.1020 as crucial support zone
- Failure to maintain $0.1000 could trigger decline toward $0.0879
Dogecoin faces mounting pressure as it trades near the $0.1031 level, marking its third consecutive week of declining prices. The meme coin remains precariously positioned just above the psychologically significant $0.1000 threshold, a zone that market participants are monitoring with heightened attention.
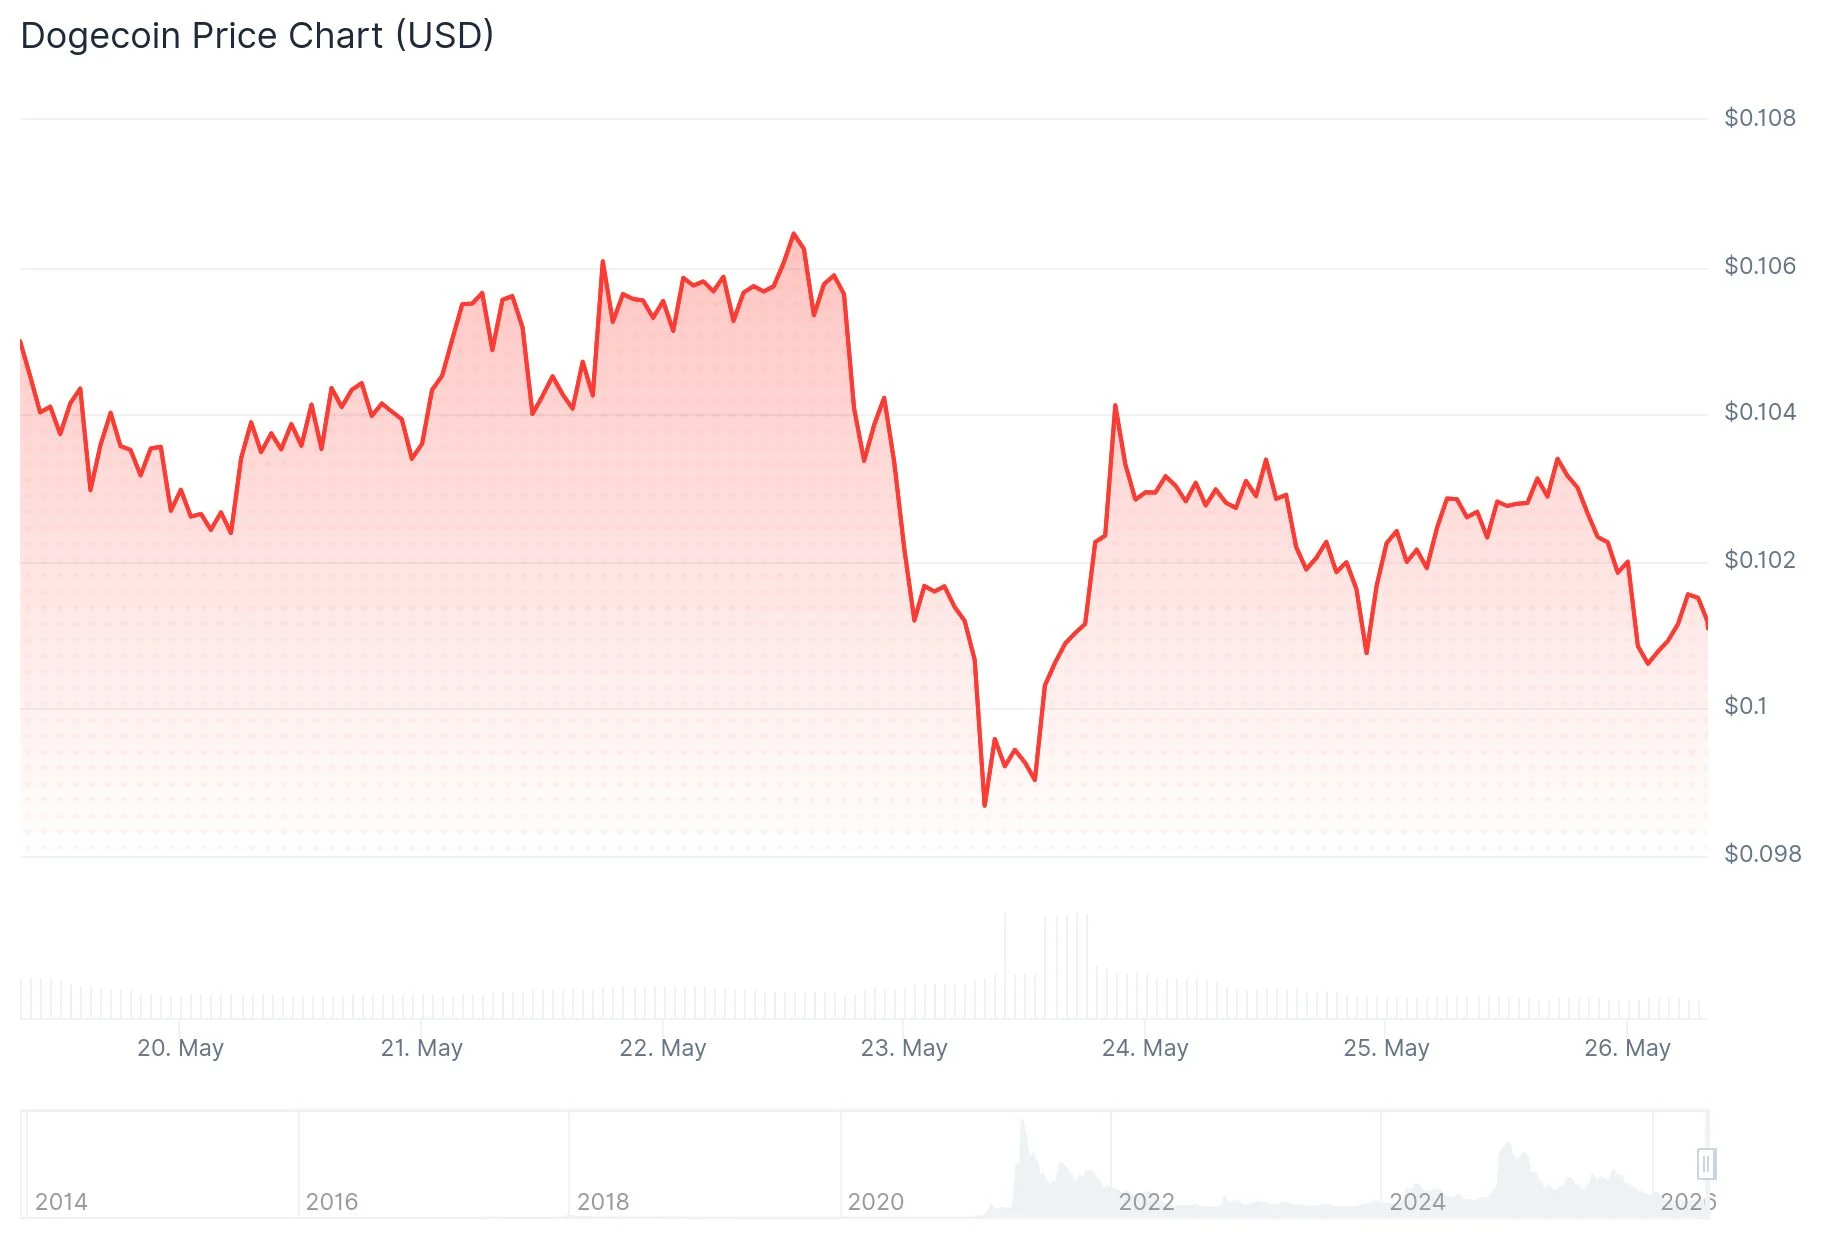
Interestingly, while price action suggests weakness, institutional appetite appears resilient. Spot ETF products tracking DOGE have recorded positive capital flows for four weeks straight. Data from Sosovalue indicates last week’s inflows reached $860,960.
This sustained institutional interest becomes more significant when contrasted against broader market trends. Bitcoin and Ethereum ETFs experienced substantial capital exits last week — approximately $1.26 billion and $216 million respectively. DOGE’s ability to attract inflows during this period represents a notable deviation from the pattern.
Derivatives metrics paint a more mixed picture. Futures trading activity has contracted 16.66% to $1.19 billion, though open interest registered a modest 1.68% increase to $1.32 billion. The current funding rate of 0.0060% indicates balanced positioning without extreme bias toward longs or shorts.
Martinez Highlights Critical Support at $0.1020
Cryptocurrency analyst Ali Martinez has drawn attention to $0.1020 as a pivotal price level for Dogecoin. His analysis indicates this zone represents a technical confluence where the midpoint of a weeks-long trading channel intersects with the 50-day simple moving average — a combination that typically carries significant weight.

According to Martinez, maintaining support at $0.1020 could enable DOGE to rally toward $0.1156, which corresponds to the upper boundary of the channel structure. However, a breakdown below this support would likely accelerate selling pressure toward the lower channel boundary around $0.0883.
Meanwhile, analyst Crypto With Gopal has identified DOGE trading within a large-scale triangle formation. His assessment characterizes this as a compression phase where buyers have successfully defended progressively higher lows, and where a breakout above triangle resistance would signal bullish continuation.
Moving Averages and Momentum Indicators Signal Weakness
DOGE currently trades beneath its 20-day EMA ($0.1056), 50-day EMA ($0.1036), 100-day EMA ($0.1059), and 200-day EMA ($0.1220). This positioning places all four key exponential moving averages above price, creating a ceiling of resistance that bulls must overcome.
Momentum indicators reinforce the bearish technical setup. The Relative Strength Index reads 45.16, positioned below the neutral threshold of 50, while its moving average sits at 52.57. Both the MACD line and signal line have crossed into negative territory, confirming downward momentum.
Should the $0.1000 support level give way, technical analysis points to the February 11 low of $0.0879 as the logical next downside target.
At present, DOGE changes hands at $0.1031, accompanied by 24-hour trading volume of $558.24 million — representing a 19.15% daily decrease.
Get 3 Free Stock Ebooks
Discover top-performing stocks in AI, Crypto, and Technology with expert analysis.
- Top 10 AI Stocks - Leading AI companies
- Top 10 Crypto Stocks - Blockchain leaders
- Top 10 Tech Stocks - Tech giants


