
 Price Alert: Critical Support Zone at Risk as Bears Take Control")
Key Highlights
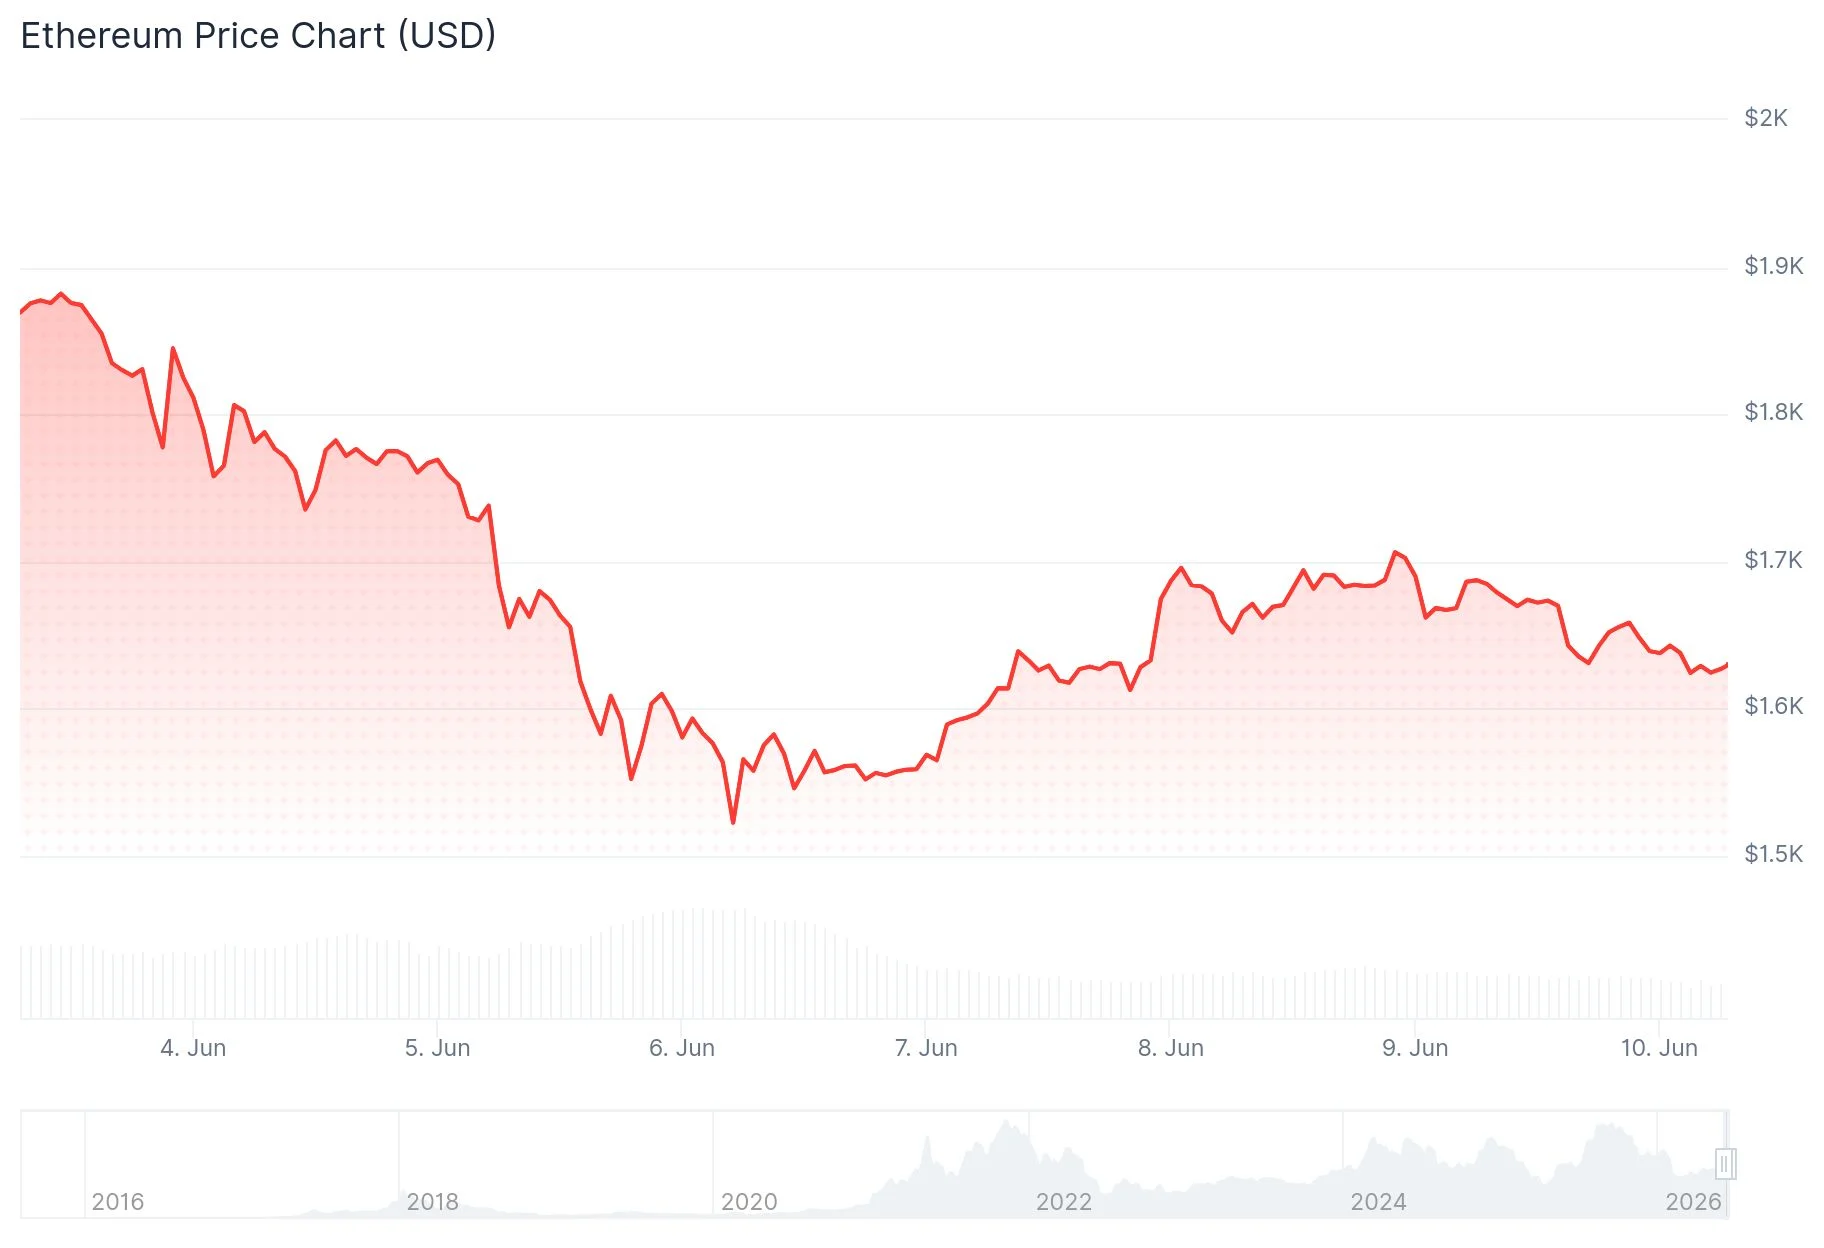
- Ethereum declined 4% over 24 hours, reaching approximately $1,628
- The $1,700 level has transformed from support into a critical resistance barrier following February 2026 lows
- Market-wide liquidations totaled $1.1 billion within a single trading day
- Exchange-traded fund flows revealed $91.37M exiting Bitcoin ETFs while $82.37M entered Ethereum ETFs
- Breaking below $1,600 may trigger a move down to the $1,500 support zone
Ethereum is currently changing hands near $1,628 following a 4% pullback over the past 24 hours. This downturn mirrors the broader cryptocurrency market’s 3.46% decline, which reduced the total market capitalization to $2.12 trillion.
Bitcoin experienced similar downward pressure, sliding from $64,100 to approximately $61,049. This sharp market correction resulted in more than $1.1 billion worth of liquidations throughout the cryptocurrency ecosystem within just one day.
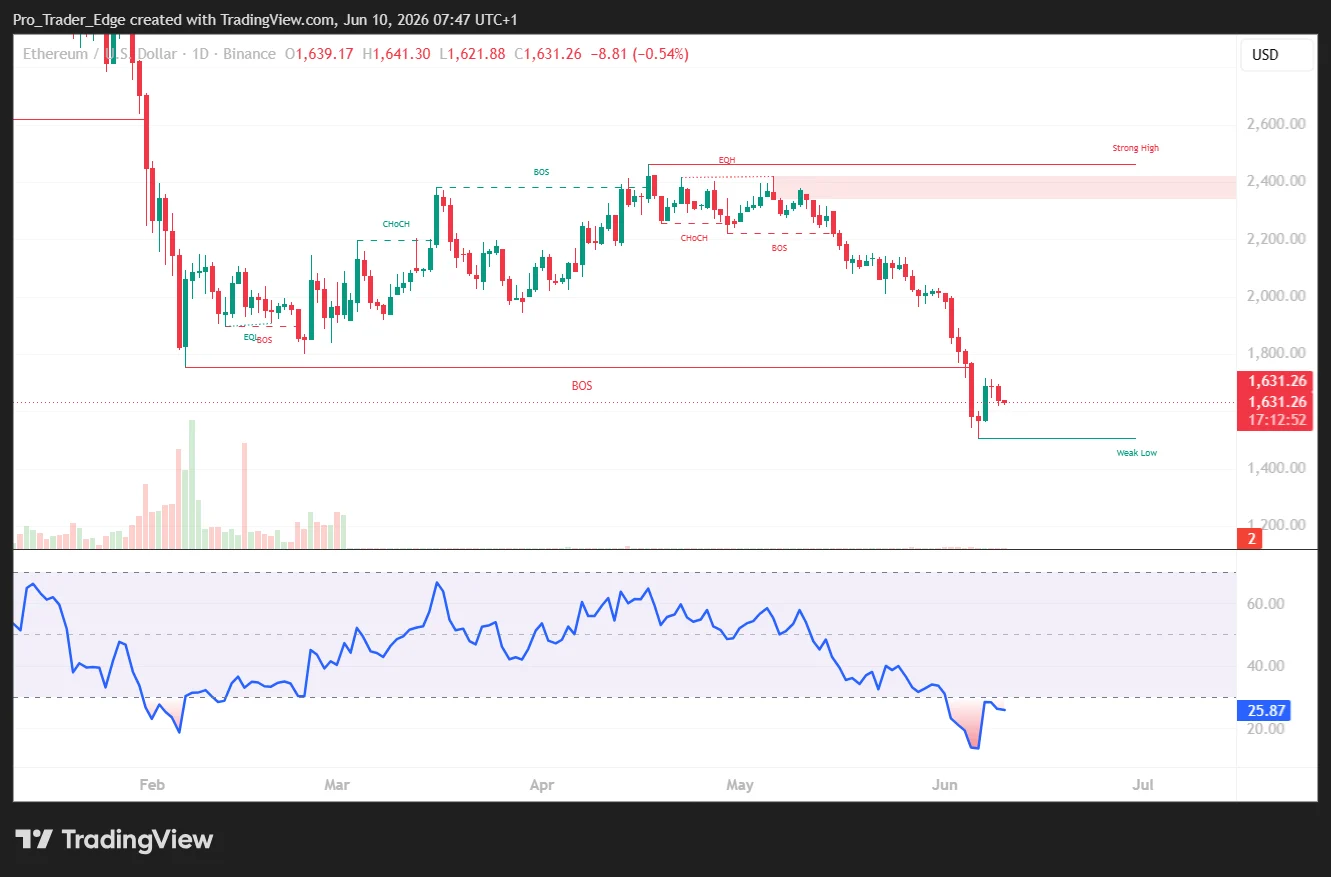
Market analyst Ted (@TedPillows) highlighted that the $1,700 price point is now functioning as a resistance level for ETH. This represents the same area where Ethereum established its February 2026 bottom, but the dynamic has reversed with sellers now actively defending this threshold.
In a post on X, Ted cautioned: “$ETH is trying to reclaim the $1,700 level. This is the zone where Ethereum bottomed in Feb 2026 and is now acting as resistance. If ETH fails to reclaim this, a sweep of lows could happen next.” His technical analysis identified $1,540 as a possible downside objective.
The market weakness extended beyond Ethereum. XRP fell beneath $1.15, confirming that the selling pressure wasn’t limited to ETH or BTC alone. Market participants attributed the moves to deteriorating risk appetite and the unwinding of highly leveraged trading positions.

Liquidation Metrics Signal Continued Market Turbulence
CryptoReviewing, a market analyst, highlighted a notable asymmetry in the 24-hour liquidation landscape: $331 million in liquidated long positions compared to $1.84 billion in liquidated short positions. This 5.5x disparity suggests potential for aggressive price swings should the market direction shift abruptly.
According to SoSoValue data, Bitcoin ETFs experienced net outflows totaling $91.37 million on June 8. In contrast, Ethereum ETFs attracted $82.37 million in net inflows during the same period, as reported by Wu Blockchain on X.
Examining the 4-hour timeframe, Ethereum was priced at $1,644 at press time. The Relative Strength Index registered around 43.21, indicating subdued momentum. The Chaikin Money Flow indicator hovers near 0.05, suggesting modest accumulation activity without significant conviction.
Critical Price Thresholds for Ethereum
The initial upside objective stands at $1,700. Successfully breaking above this barrier would create an opportunity to challenge $1,800, a level analysts believe would enhance overall market confidence.
Should Ethereum push beyond $1,800, the next meaningful resistance zone appears at $2,000.
Regarding downside risk, $1,600 represents the crucial support threshold. Losing this level would likely result in a retest of the $1,500 area.
As of this analysis, ETH was maintaining a position slightly above $1,600, though momentum indicators continue to reflect bearish tendencies.
Get 3 Free Stock Ebooks
Discover top-performing stocks in AI, Crypto, and Technology with expert analysis.
- Top 10 AI Stocks - Leading AI companies
- Top 10 Crypto Stocks - Blockchain leaders
- Top 10 Tech Stocks - Tech giants

