



Key Takeaways
- Ethereum maintains support above $1,825 following a decisive break of resistance, with bullish targets extending to $2,500
- Spot Ethereum ETFs in the U.S. recorded consecutive weekly inflows totaling $105.44 million
- Ethereum ETF holdings climbed to $9.97 billion, approaching the critical $10 billion threshold
- The ETH/BTC ratio is challenging the upper limit of a multi-month descending channel
- Market analyst Ali Charts emphasizes $1,850 as the crucial support zone for continuation toward $2,300
Currently trading near $1,865, Ethereum has staged an impressive comeback from its June bottom around $1,505. Throughout July, the digital asset has established a series of ascending peaks and troughs, prompting market participants to evaluate whether a push beyond $2,000 is imminent.
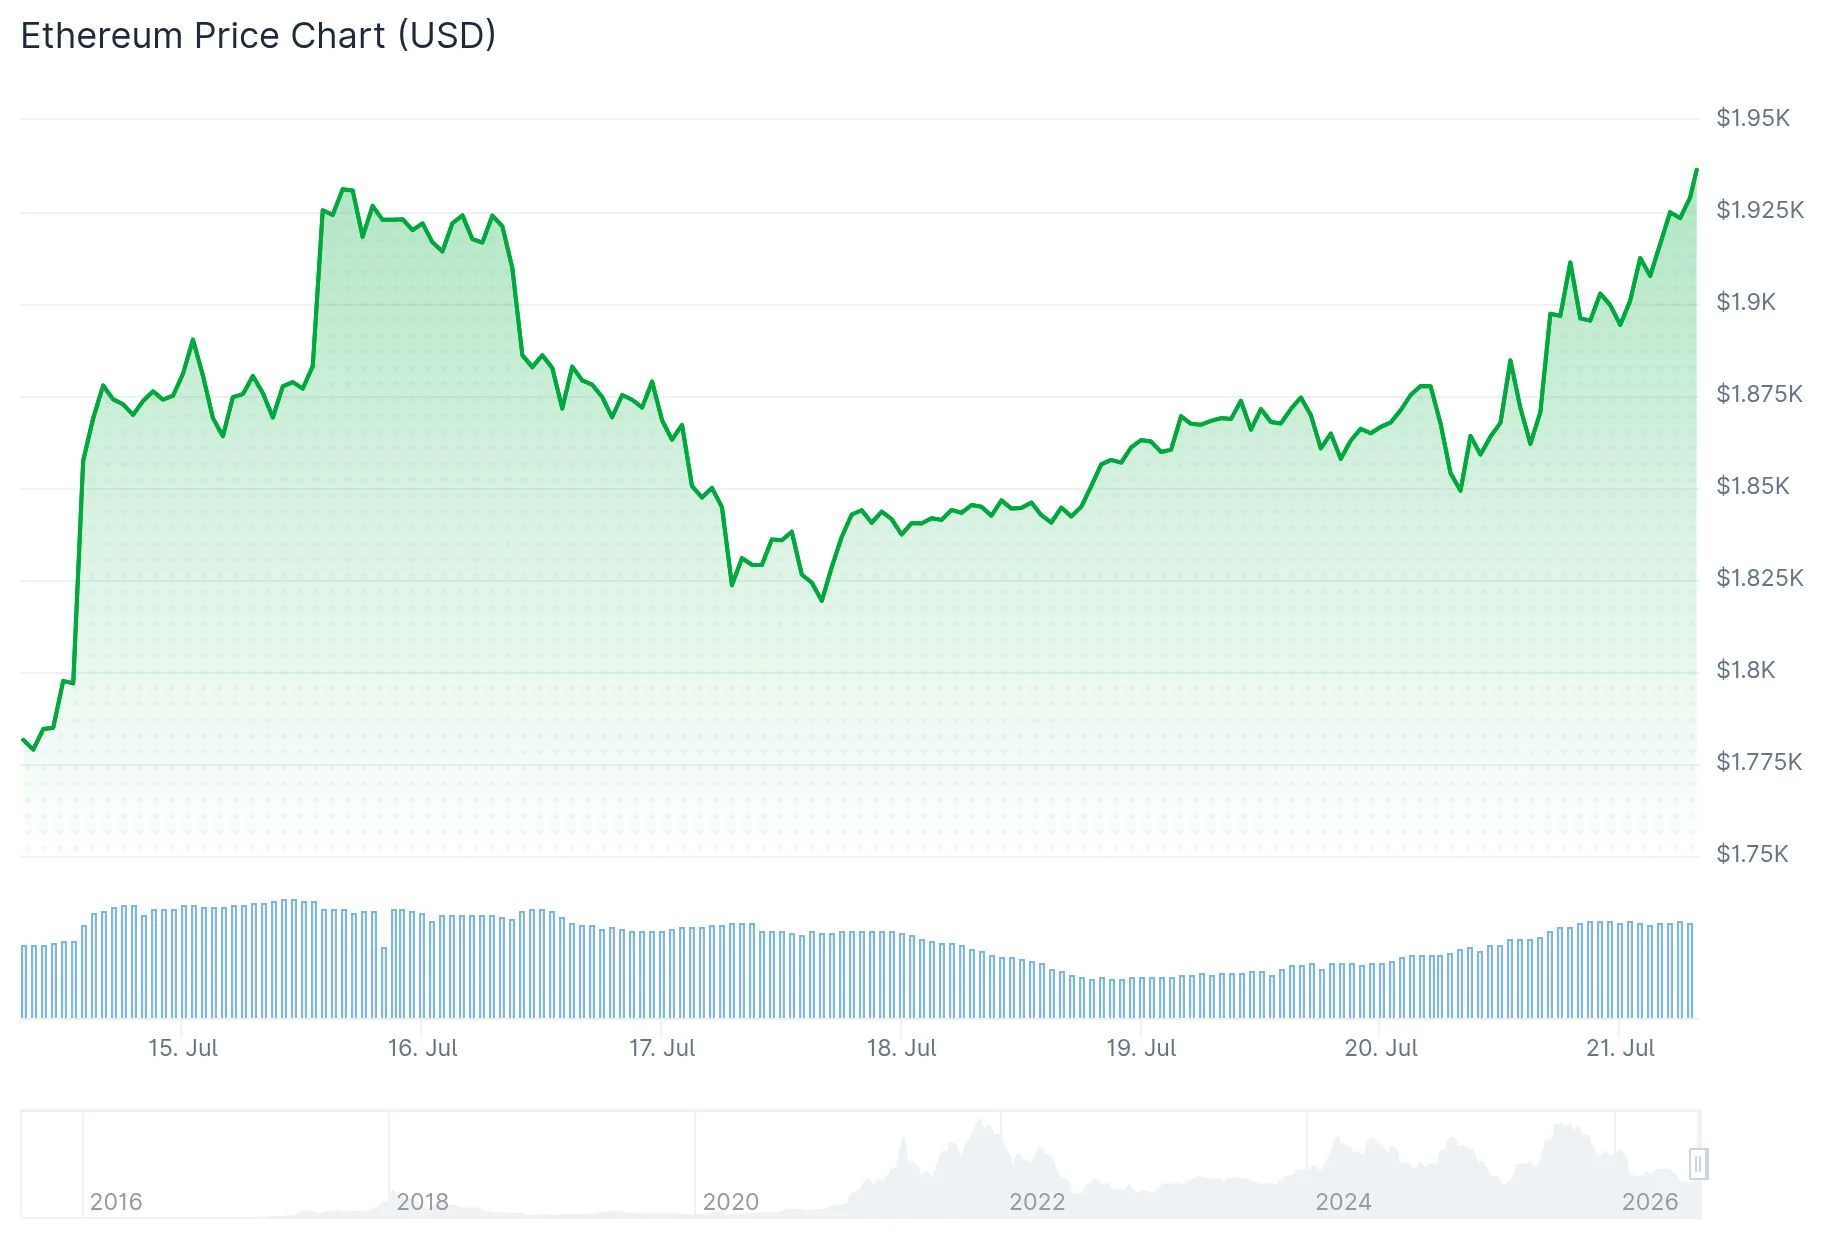
The nearest barrier to overcome stands at $1,900. Successfully clearing this threshold would spotlight the round-number $2,000 zone, a region that previously acted as supply and must be conquered to validate the upward trend.
Should Ethereum defend the $1,825 floor while continuing to establish elevated support levels, market observers anticipate potential movement toward the $2,465-$2,620 corridor. The extended bullish objective encompasses the $2,500 to $2,620 range.
Technical analyst Ali Charts highlighted that if Ethereum is constructing a double bottom formation, maintaining the $1,850 zone becomes essential. Ali Charts suggests that preserving this foundation opens the door to $2,300 as the subsequent upside destination.
Market commentator Ted Pillows observed that ETH has successfully recaptured its 6-month descending trendline while the weekly MACD indicator has turned positive. He highlighted that figures like investor Tom Lee and multiple institutional players continue accumulating, suggesting that defending $1,850 could trigger an additional 10% advance.

Institutional Capital Flows Back Through ETF Channels
Ethereum spot ETFs in the United States attracted $105.44 million in net capital during the week concluding July 17, building on the prior week’s $84.42 million influx. This development reversed a streak of five consecutive weeks showing net redemptions spanning mid-May through late June.
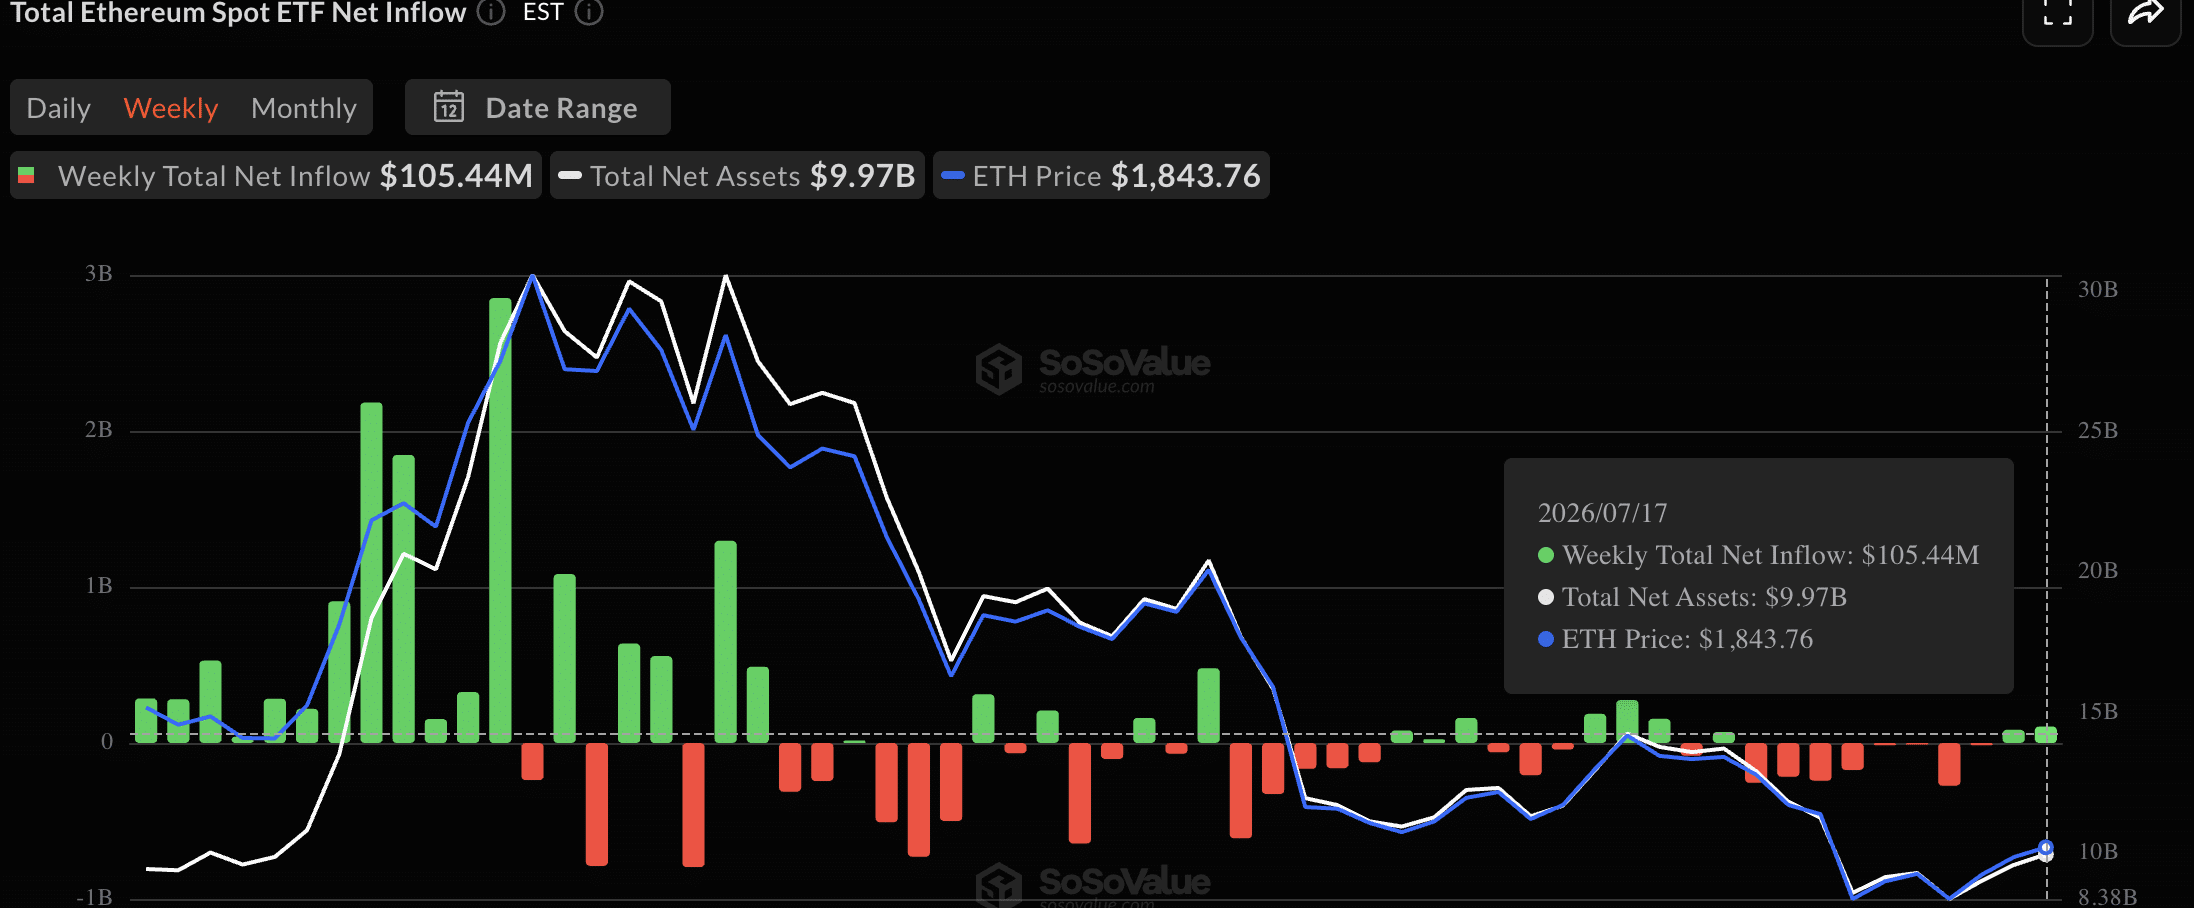
Aggregate net flows have accumulated to $11.08 billion. Total assets under management in these ETF products reached $9.97 billion, positioned just beneath the psychologically significant $10 billion milestone.
BlackRock’s ETHA product dominated inflows, capturing $31.68 million on July 17 as a standalone session, and currently oversees $5.22 billion in net holdings—representing more than half of the entire U.S. spot Ethereum ETF landscape. Fidelity’s FETH contributed an additional $5.05 million.
Ethereum-Bitcoin Ratio Shows Signs of Reversal
The ETH/BTC trading pair is probing the upper resistance of a year-long declining channel structure situated around the 0.0285-0.029 BTC level. Following a bounce from long-term support near 0.0262 BTC, a definitive breakout could drive the ratio toward 0.030 BTC initially, with 0.032 BTC representing the next objective.
A durable rally in the ETH/BTC ratio would likely catalyze positive momentum throughout the broader Ethereum ecosystem and associated tokens.
Examining the weekly timeframe, the Relative Strength Index hovers around 40, reflecting recovery from oversold territory but remaining beneath the neutral midpoint of 50. The daily chart shows RSI advancing to 58.
The $1,800 threshold now functions as primary support. BlackRock’s ETHA product registered $31.68 million in single-day inflows on July 17, representing the latest session with publicly available data.
Get 3 Free Stock Ebooks
Discover top-performing stocks in AI, Crypto, and Technology with expert analysis.
- Top 10 AI Stocks - Leading AI companies
- Top 10 Crypto Stocks - Blockchain leaders
- Top 10 Tech Stocks - Tech giants


