
 Price Surges 5% as Historic Buy Signal Emerges—What Comes Next?")
Key Takeaways
- Ethereum has surged over 5% in the last day, moving back above the critical $1,650 support zone
- A massive short squeeze liquidated over $92 million worth of ETH positions, driving the upward momentum
- Despite the rally, spot Ethereum ETFs continue bleeding with -$358.3 million in outflows since mid-June, signaling institutional hesitance
- The TD Sequential indicator has triggered a monthly buy signal—historically followed by gains of 235% and 182% in previous cycles
- Technical analyst Ted Pillows warns ETH needs to break above $1,700–$1,750 or risk retreating to annual lows
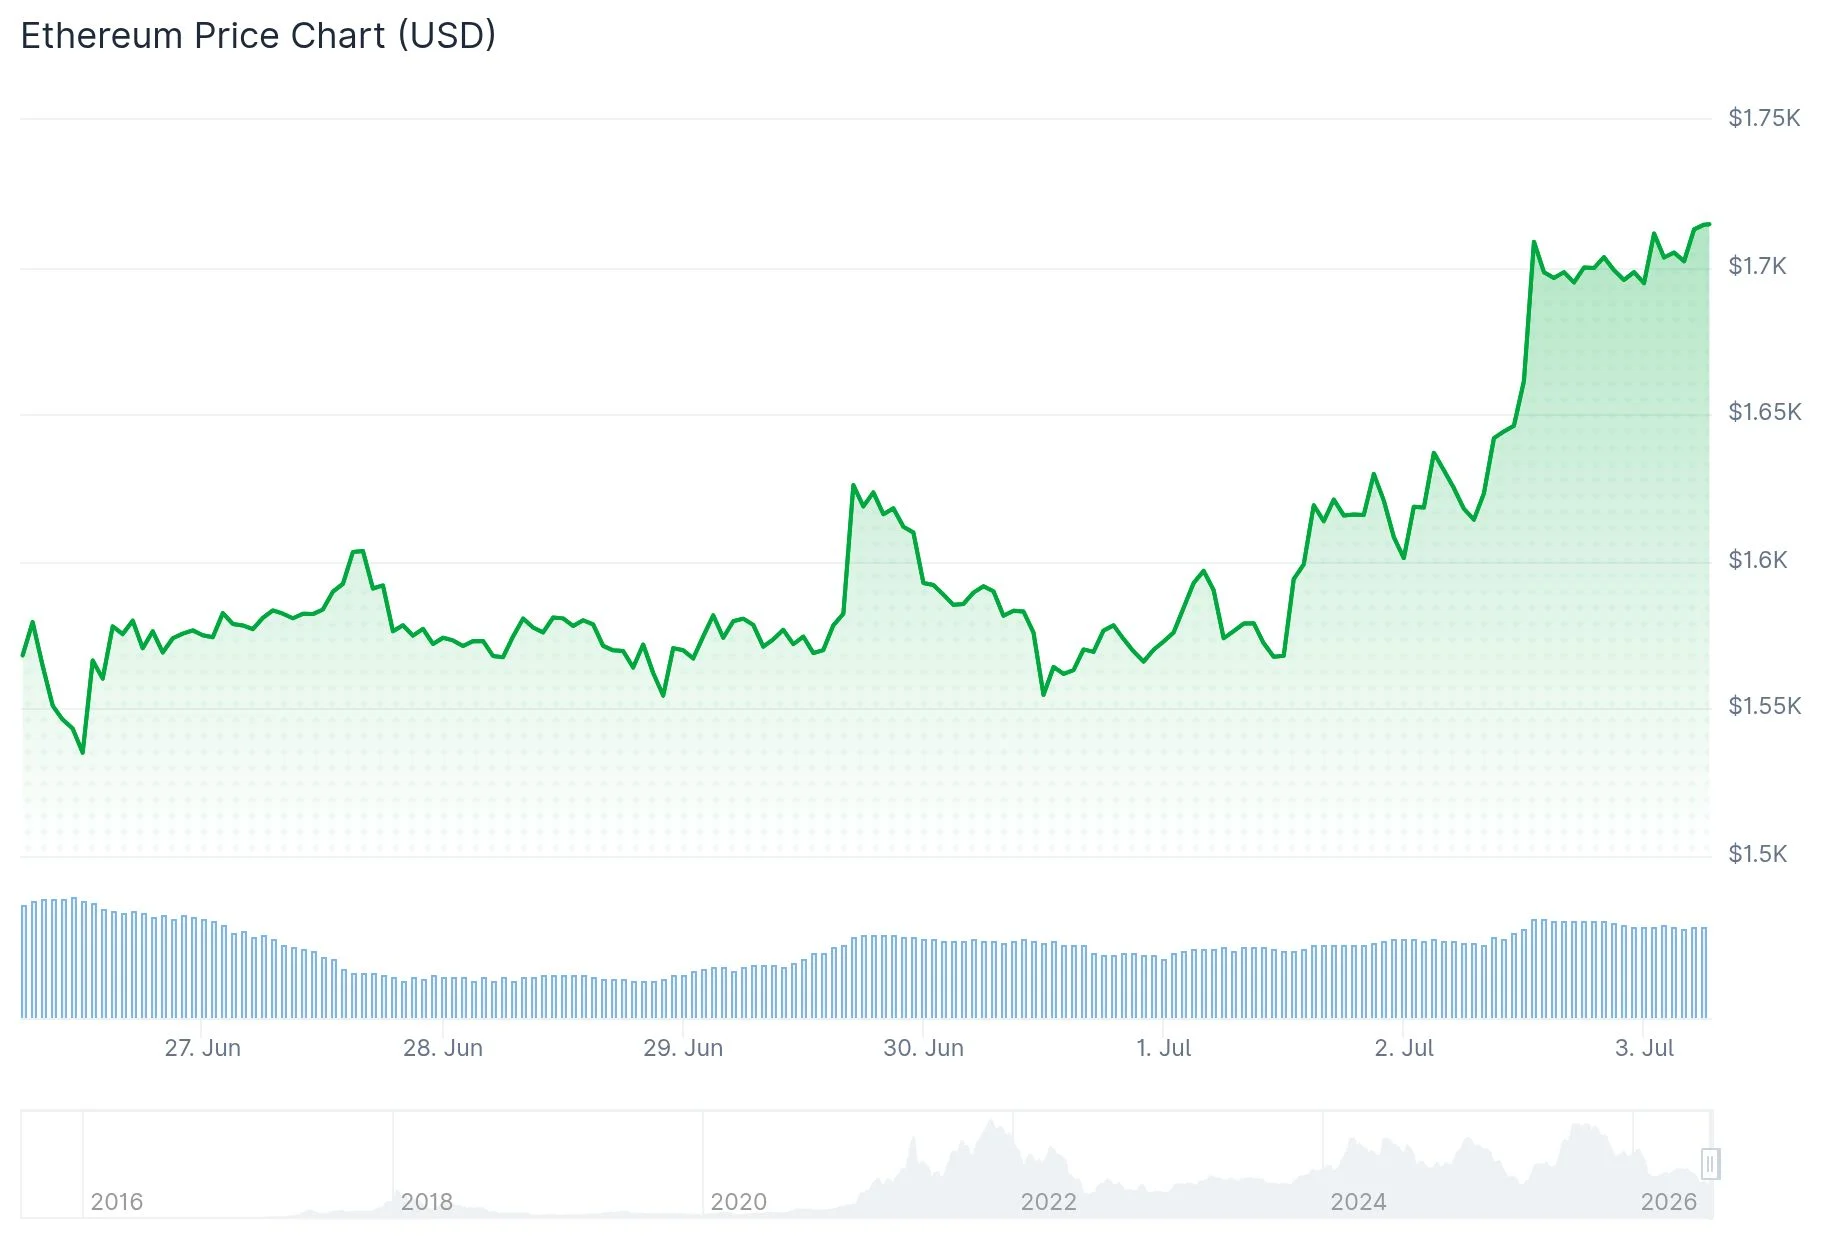
Ethereum has mounted an impressive comeback over the last 24 hours, surging more than 5% to reclaim territory above $1,650 following an extended period of downward pressure. The world’s second-largest digital asset by market capitalization has posted weekly gains of 8.05%, though it continues trading significantly beneath the $2,000 threshold it lost grip of earlier this year.
The sharp upward movement was catalyzed by a dramatic cascade of liquidations. Approximately $92 million in bearish ETH positions were forcibly closed as prices climbed rapidly, creating a classic short squeeze scenario. The broader cryptocurrency market witnessed liquidations exceeding $475 million during this same timeframe.
Activity in Ethereum’s derivatives markets showed significant expansion. Trading volume for ETH futures contracts increased by roughly 29% to reach $43.4 billion, while open interest climbed past $22.8 billion. Options trading activity surged nearly 57% to $915 million. The combination of rising prices alongside expanding open interest indicates new money flowing into the market rather than merely short covering.
Funding rates have remained in positive territory, indicating that traders maintaining long positions are willing to pay premiums—a reflection of near-term bullish sentiment.
Historic Technical Indicator Captures Attention
Cryptocurrency analyst Ali Martinez highlighted on X that July’s opening brought a buy signal on the monthly chart from the TD Sequential technical indicator. This same signal materialized in September 2022 and March 2025. Following those previous occurrences, Ethereum rallied 235% and 182% respectively. Martinez’s observation has gained traction particularly as ETH’s recent bounce from $1,549 aligns with the -1.0σ band on Ethereum’s MVRV extreme deviation pricing framework.

However, spot Ethereum flows paint a contrasting picture. Ethereum spot ETFs have experienced cumulative net outflows totaling $358.3 million since June 17, suggesting institutional participants remain unconvinced.
Critical Resistance Zones Ahead
Analyst Ted Pillows noted on X that while ETH has reclaimed the $1,600 level, the asset must push through the $1,700–$1,750 range to validate any sustained bullish momentum. Failure to achieve this breakthrough could send ETH tumbling back toward its yearly lows.
Technically speaking, the next significant resistance barrier stands at $1,700, with additional challenges at the $1,800–$1,850 zone where the 50-day moving average currently resides. Should support fail, a break below $1,600 would likely trigger a retest of the $1,550 support level.
Notable whale movements have also sparked interest. High-profile crypto investor Machi Big Brother allegedly expanded ETH holdings after liquidating several NFT positions, fueling speculation that major players view current price levels as attractive accumulation opportunities.
As of July 2, 2026, ETH is changing hands near $1,650, with the $1,700 threshold representing the immediate challenge for bullish traders.
Get 3 Free Stock Ebooks
Discover top-performing stocks in AI, Crypto, and Technology with expert analysis.
- Top 10 AI Stocks - Leading AI companies
- Top 10 Crypto Stocks - Blockchain leaders
- Top 10 Tech Stocks - Tech giants

