



Key Takeaways
- Crypto analyst Ali Charts identifies a triangle formation on ETH’s 12-hour timeframe that historically preceded a 31% surge, with $3,000 as a potential target
- Spot Ethereum ETFs recorded $216.41 million in net inflows on September 11, with BlackRock’s ETHA fund contributing $148.82 million
- ETH successfully breached the $2,300–$2,400 resistance barrier, which traders now monitor as a critical support zone
- Technical indicators show declining momentum with MACD turning bearish while ETH hovers around $2,478 and RSI reads 51.77
- A breakdown below $2,490 could trigger a test of the $2,400 support threshold
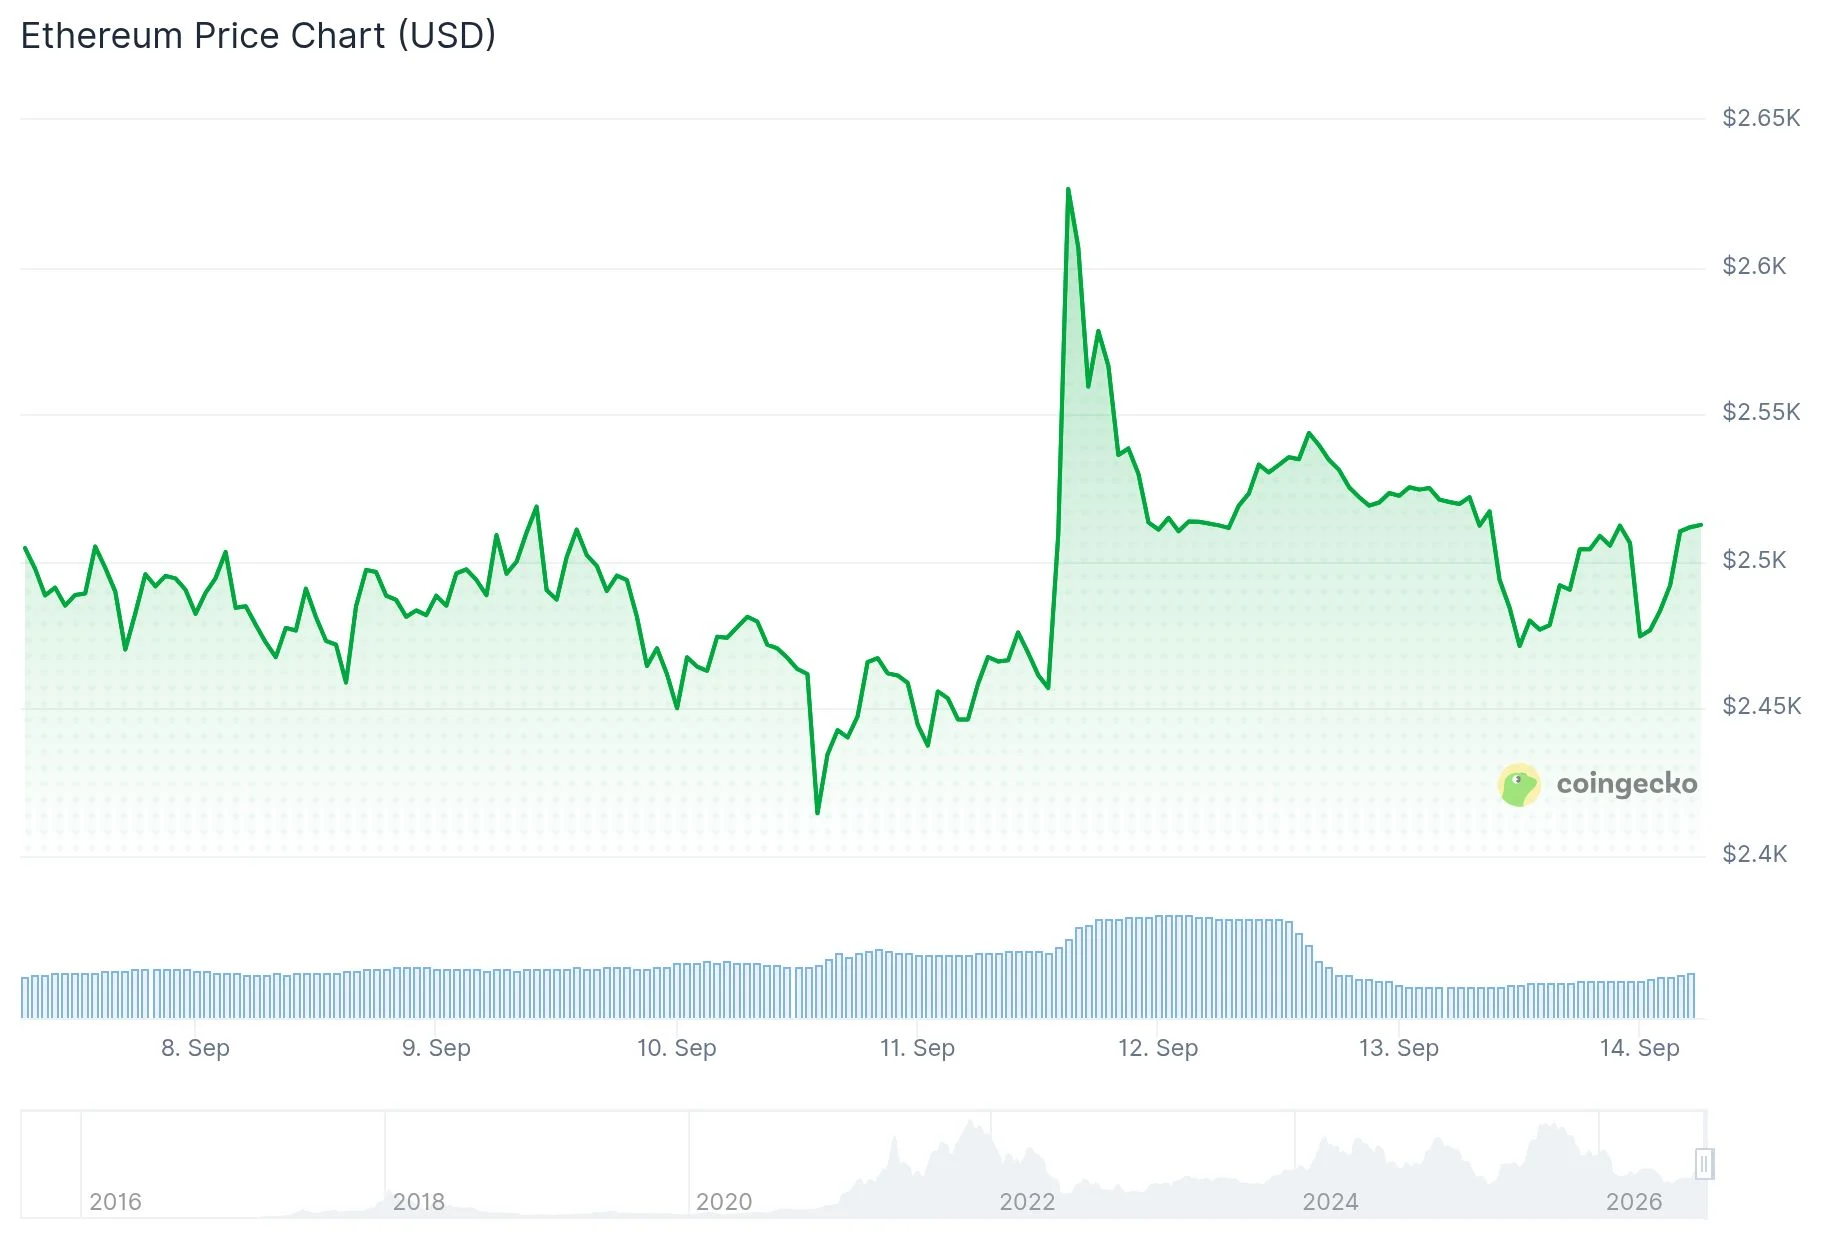
Ethereum is consolidating around the $2,478 level while market participants analyze an emerging technical formation that suggests a potential move toward $3,000. Traders are simultaneously monitoring the upcoming Federal Reserve policy meeting on September 15–16, which may influence sentiment across cryptocurrency and broader risk asset markets.
Market analyst Ali Charts has identified a triangle consolidation pattern developing on Ethereum’s 12-hour chart. According to Ali Charts, the previous occurrence of a comparable triangle structure resulted in a dramatic 31% price increase over a three-day period. In a post shared on X, Ali Charts stated: “The last triangle breakout sent Ethereum surging 31% in just three days. Now, another triangle is forming. If $ETH breaks out again, a similar move could send it to $3,000.” It’s important to note this represents a potential scenario rather than a definitive forecast.
\p dir=”ltr”>Another market observer, Wealthmanager, highlighted on September 13 that Ethereum has successfully penetrated its higher timeframe resistance level between $2,300 and $2,400, whereas Bitcoin remains below its corresponding resistance band at $82,000–$83,000. Wealthmanager anticipates ETH could climb to $3,000 before experiencing a potential retracement back toward the $2,300 region.
Institutional Capital Flows Into Ethereum ETFs
Spot Ethereum exchange-traded funds captured $216.41 million in net inflows during the September 11 trading session. BlackRock’s ETHA product dominated the daily flows, securing $148.82 million in fresh capital. Bitwise’s ETHW attracted $29.09 million, while BlackRock’s ETHB garnered an additional $18.32 million, and Fidelity’s FETH fund collected $11.40 million.
Grayscale’s ETH product registered $5.09 million in inflows, and VanEck’s ETHV secured $3.71 million. Meanwhile, Grayscale ETHE and Franklin EZET reported zero new capital for the day. Cumulative historical inflows across all Ethereum ETF products have reached $13.39 billion, with aggregate net assets standing at $16.31 billion — accounting for 5.28% of Ethereum’s entire market capitalization. Daily trading volume on September 11 totaled $2.56 billion.

Critical Technical Levels Under Observation
Trader Daan Crypto Trades observed that ETH has retraced toward its breakout region following the recent upward movement. He pointed out that open interest in perpetual futures contracts has declined, potentially reducing excessive leverage in the market.
Ethereum is currently trading near the middle Bollinger Band positioned at $2,470. The upper band is located at $2,543, while the lower band sits at $2,396. The MACD indicator shows the main line at 81.68 trading beneath its signal line at 99.69, with a histogram value of -18.01, indicating diminishing bullish momentum.
The Relative Strength Index on the four-hour chart registers 51.77, marginally above the neutral 50 threshold. A sustained move above $2,550 would bring the recent $2,600 peak back into consideration. Below current levels, Ethereum’s most significant support zone lies at $2,400.
Get 3 Free Stock Ebooks
Discover top-performing stocks in AI, Crypto, and Technology with expert analysis.
- Top 10 AI Stocks - Leading AI companies
- Top 10 Crypto Stocks - Blockchain leaders
- Top 10 Tech Stocks - Tech giants


