
 Sinks Below $2,000 Amid Weakening Institutional Demand")
Key Takeaways
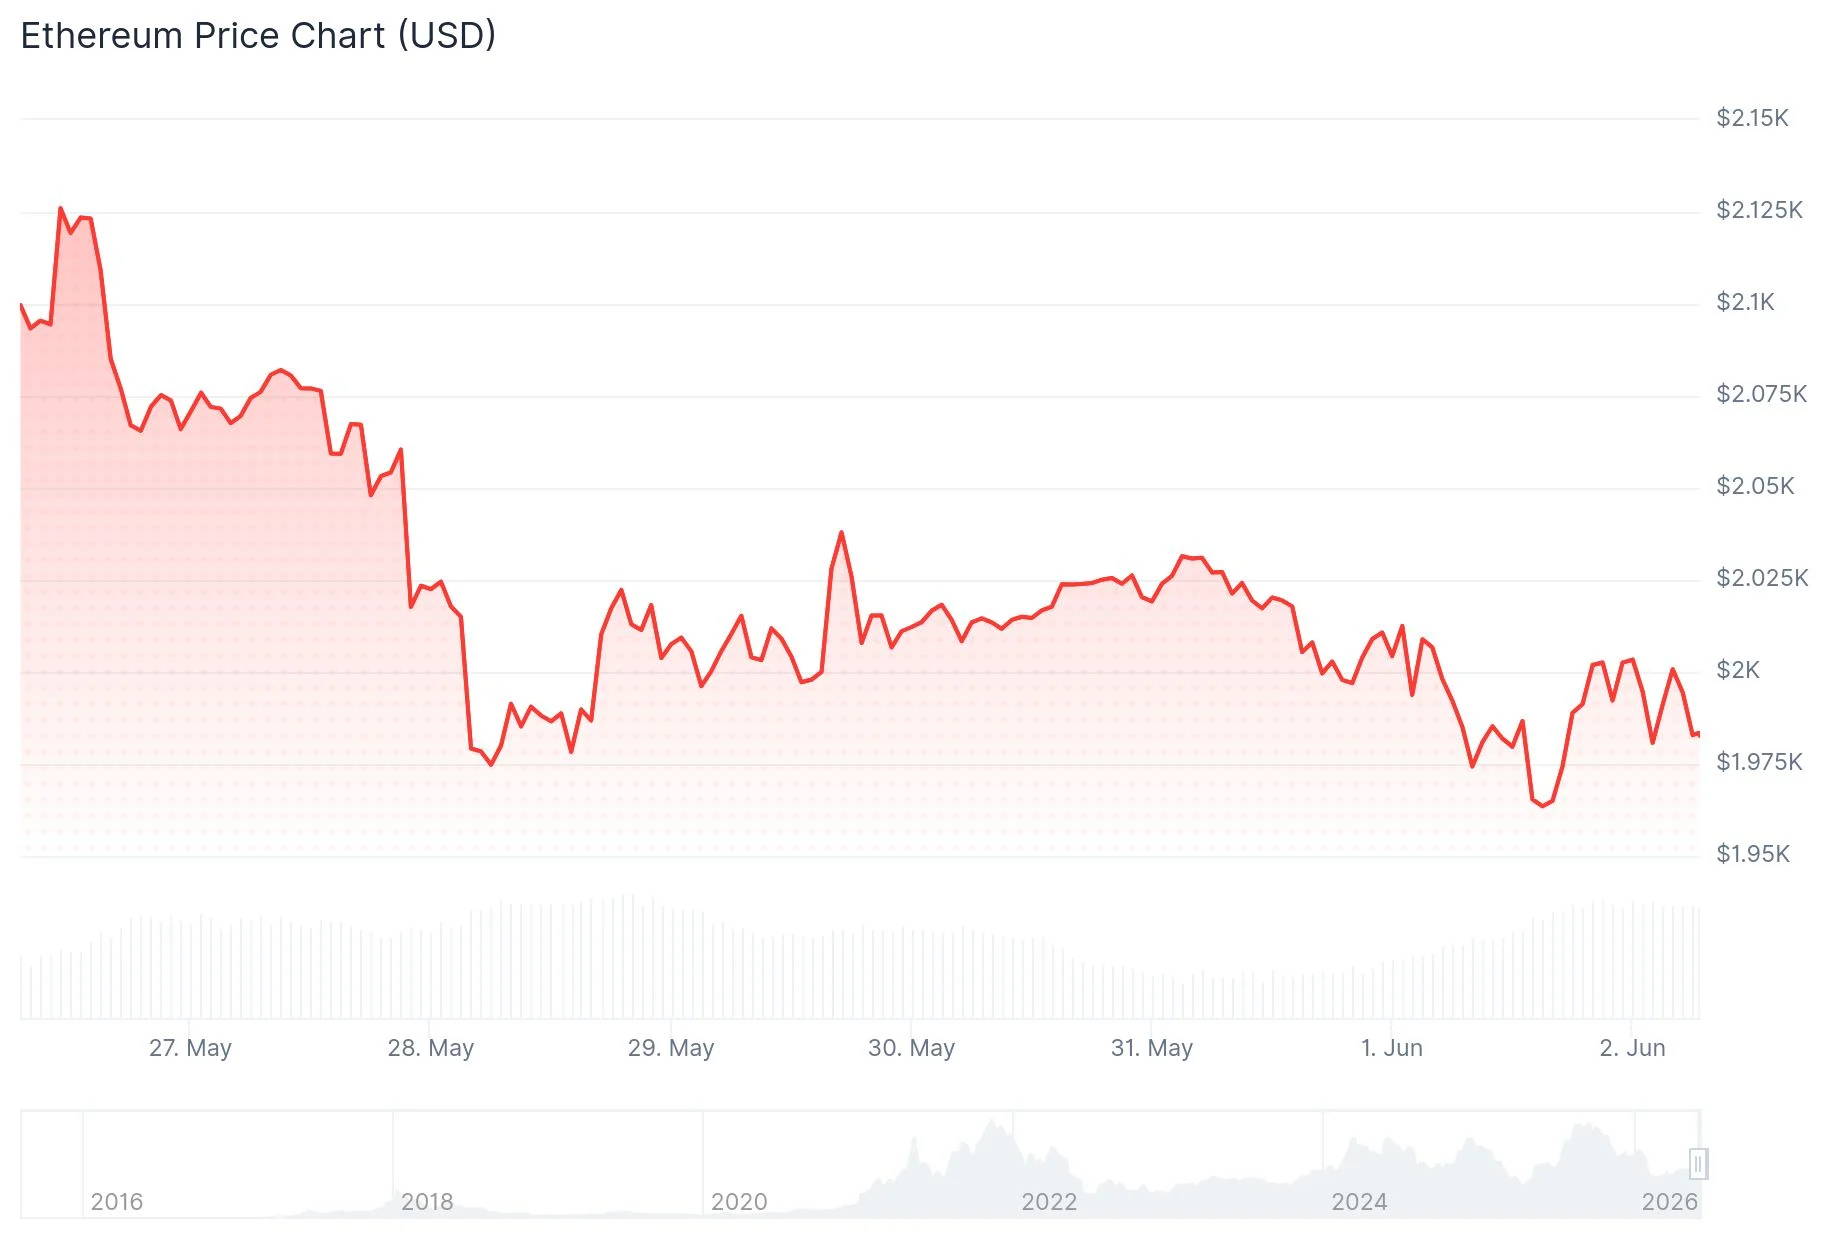
- Ethereum slipped beneath the $2,000 threshold, reaching a session low of $1,955
- BitMine acquired 26,497 ETH during the previous week — marking its third-smallest weekly acquisition since implementing an Ethereum treasury approach
- BitMine’s current ETH position shows unrealized losses approaching $9 billion
- Spot Ethereum ETFs in the United States registered their third consecutive week of negative net flows
- Critical support zone identified at $1,909; breach of this level could trigger decline toward $1,741
Ethereum has fallen beneath the psychologically important $2,000 level following renewed downward momentum that drove prices to an intraday bottom of $1,955. The digital asset continues to face challenges maintaining stability as bearish sentiment dominates across various time horizons.
BitMine Immersion Technologies (BMNR) added 26,497 ETH to its reserves during the past week, expanding its aggregate position to 5.41 million ETH, valued at approximately $10.72 billion at current market rates. This weekly acquisition represents the firm’s third-smallest purchase volume since adopting its Ethereum-focused treasury approach in 2025.
According to BitMine Chairman Thomas Lee, the company has deliberately reduced its acquisition velocity because it has already surpassed its internal timeline for reaching a 5% stake in ETH’s total circulating supply. Lee further noted that prevailing ETH valuations fail to accurately represent Ethereum’s strengthening underlying fundamentals.
Nonetheless, BitMine’s aggregate ETH holdings currently show unrealized losses totaling approximately $9 billion, based on information from CryptoQuant analytics.
Market analyst Rekt Capital highlighted on X that Ethereum has now registered monthly closes beneath its long-term ascending trendline twice within the last five months. He cautioned that bounce attempts from this critical trendline are showing diminishing strength and emphasized that ETH must either defend its 2026 lows or successfully recapture the trendline to prevent additional bearish continuation.

Institutional Capital Withdrawal Intensifies Selling
United States-based spot Ethereum ETF products have experienced negative net capital flows for three straight weeks, according to tracking data from SoSoValue. This pattern reflects ongoing hesitation among institutional market participants.
Strategy, which maintains the largest cryptocurrency treasury by total value, recently revealed it liquidated 32 BTC during the previous week, generating $2.5 million in proceeds to satisfy preferred stock dividend obligations. This transaction contributes to the broader narrative of digital asset corporate treasuries experiencing financial strain.
Ethereum witnessed $106.3 million in forced liquidations throughout the preceding 24-hour period. Long position liquidations comprised $90.3 million of this aggregate figure, per data compiled by Coinglass.
Critical Technical Zones Under Surveillance
Examining the daily timeframe, Ethereum is currently positioned beneath its 20-day, 50-day, and 100-day exponential moving averages, which register at $2,098, $2,172, and $2,269 respectively. Having price action below all three principal moving averages generally indicates a prevailing bearish momentum structure.
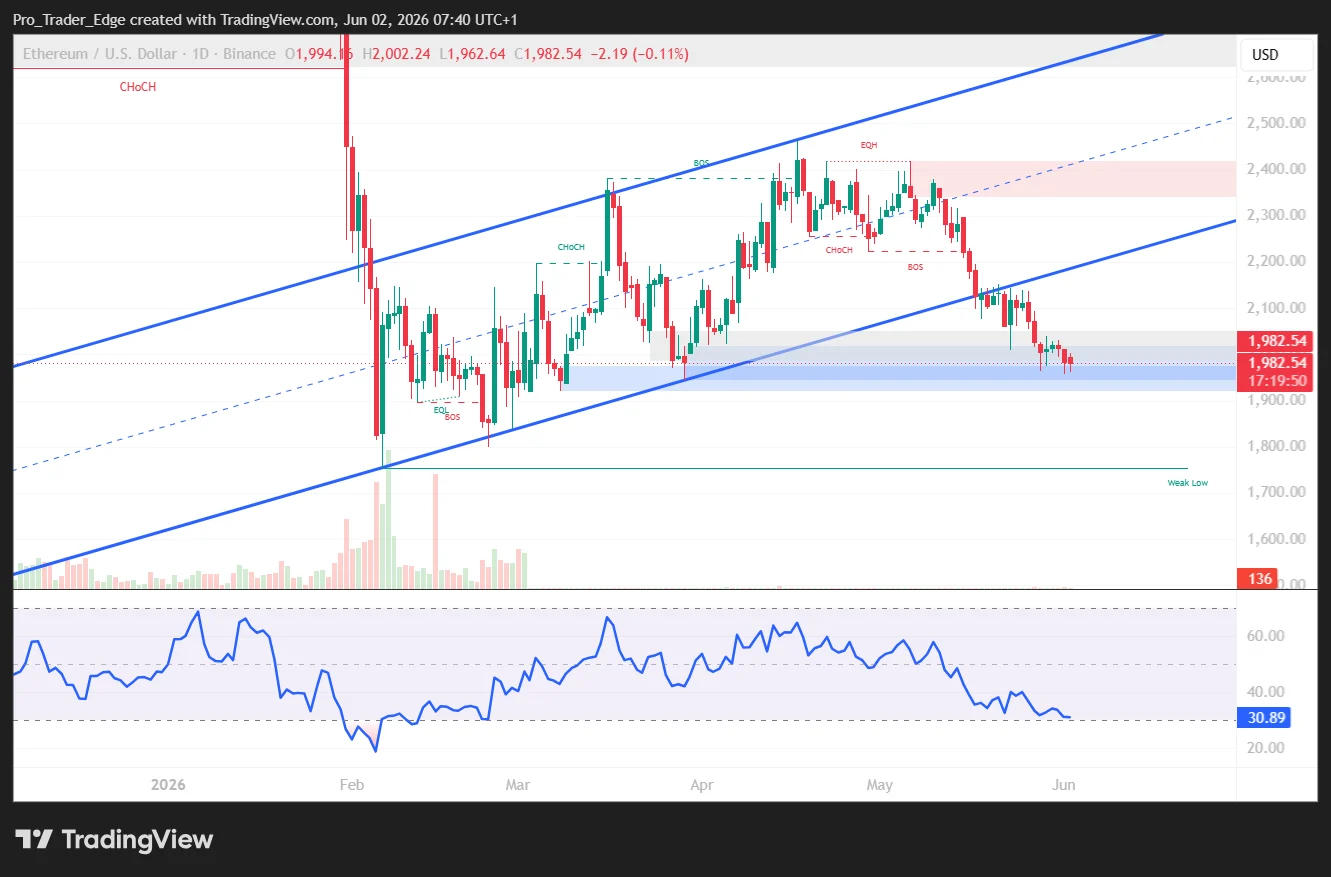
The 14-period Relative Strength Index sits near the 30 threshold while the Stochastic Oscillator has descended into deeply oversold conditions. Although these readings confirm substantial selling intensity, oversold conditions alone do not guarantee an imminent price reversal.
Regarding upside obstacles, immediate resistance barriers are positioned at $2,000, $2,020, $2,050, and $2,080. Successfully breaching $2,050 resistance could facilitate advancement toward $2,120 or potentially $2,150.
On the downside, initial support emerges at $1,955, with subsequent floors at $1,920 and $1,909. A decisive breakdown below $1,909 would bring $1,741 into view, while extended selling could target deeper support zones at $1,524 and $1,404.
ETH currently trades near $1,980, positioned below the 100-hour Simple Moving Average, with bearish trend line resistance establishing itself around $2,010 on shorter timeframes.
Get 3 Free Stock Ebooks
Discover top-performing stocks in AI, Crypto, and Technology with expert analysis.
- Top 10 AI Stocks - Leading AI companies
- Top 10 Crypto Stocks - Blockchain leaders
- Top 10 Tech Stocks - Tech giants

