
 Enters Unprecedented Territory With 8 Straight Monthly Losses")
TLDR
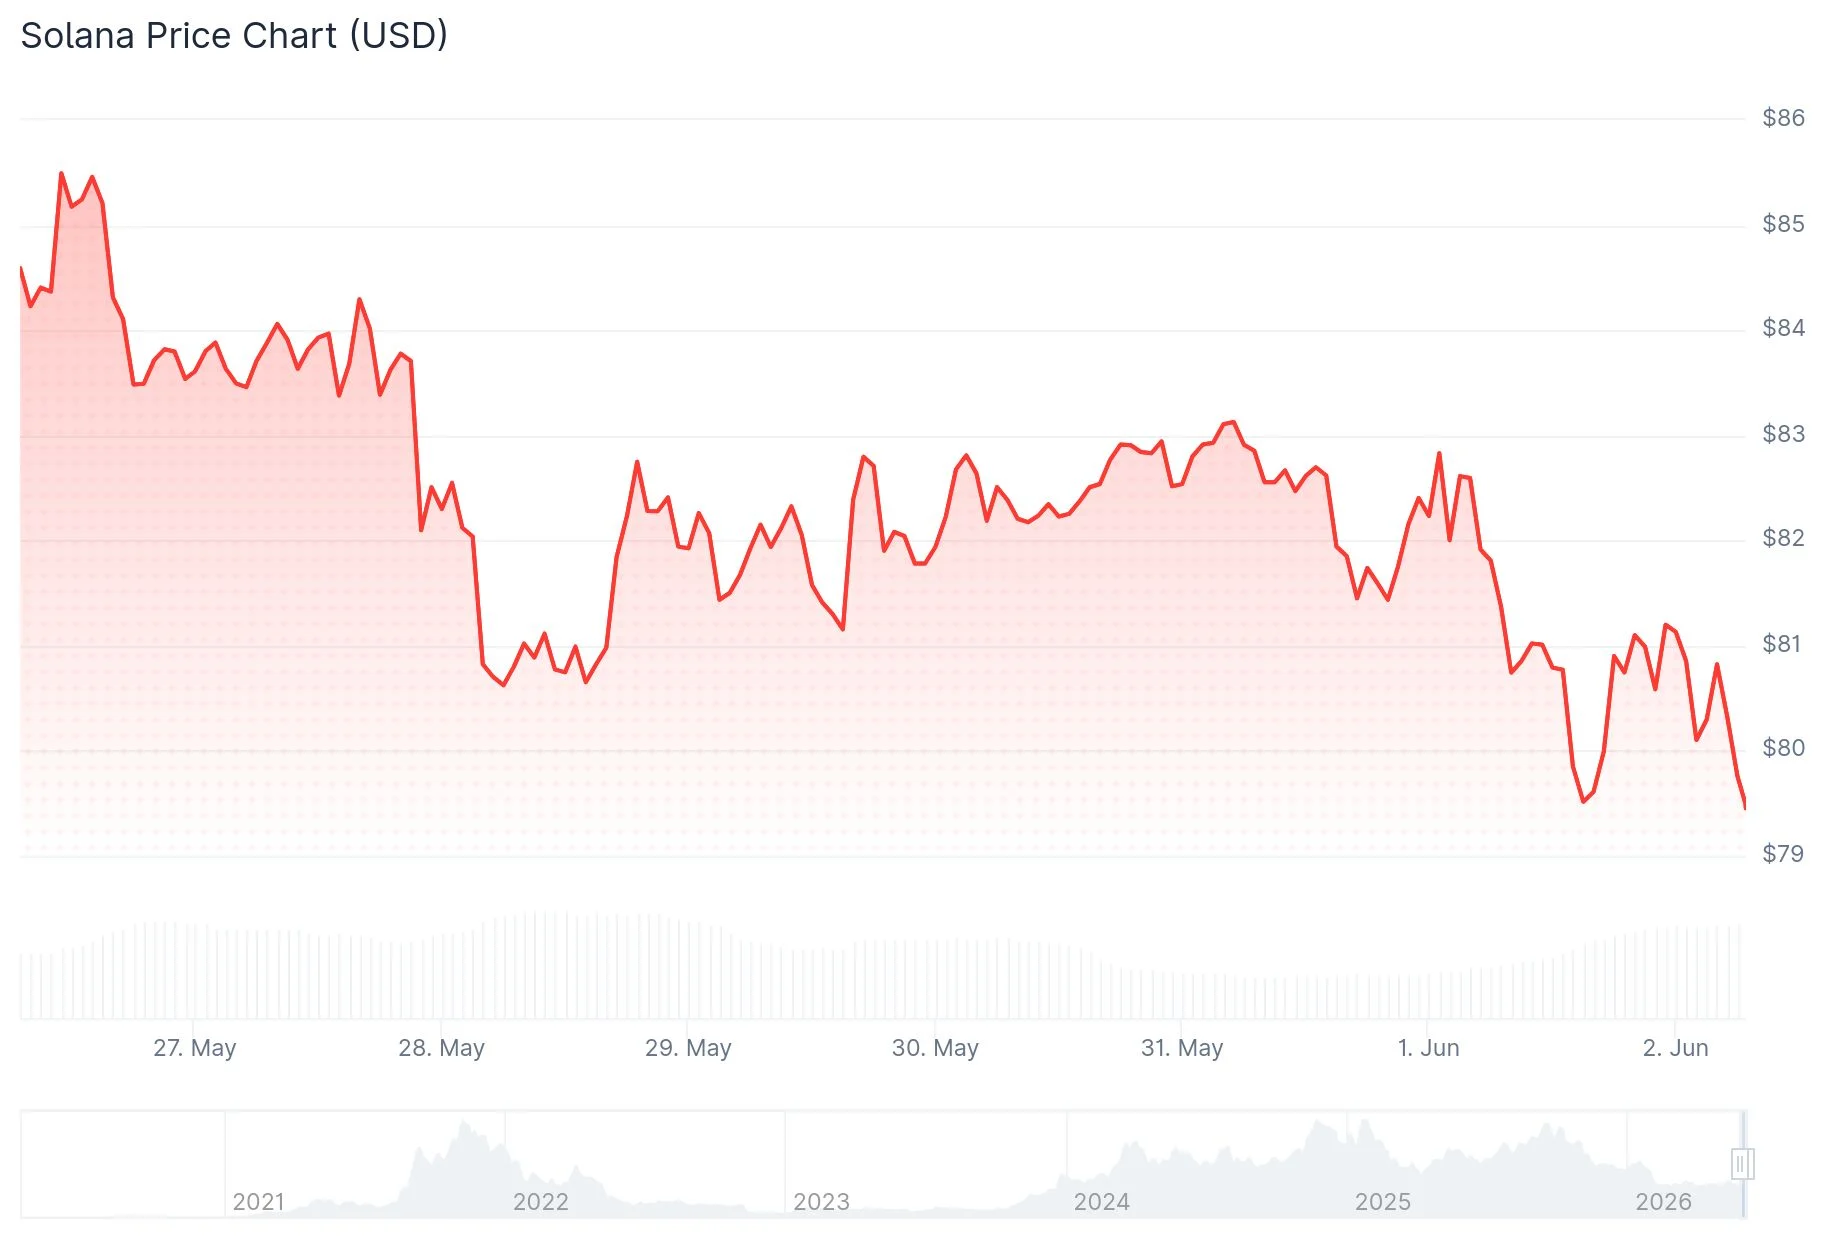
- Solana is currently changing hands around $79.50, confined within a $76–$90 trading corridor that has persisted for multiple months
- Network participants have declined from 3 million users to under 2 million; decentralized exchange volume and Open Interest are experiencing downward pressure
- Short position liquidations are concentrated in the $83–$87 range, potentially setting the stage for an upward move if prices reach that zone
- Crypto analyst Patel highlights that SOL has experienced 8 straight monthly red candles for the first time ever — echoing dynamics from the 2021 bear market
- Critical support zone identified at $68.02; a breakdown beneath this threshold would negate the existing bullish technical framework
Solana has experienced sustained downward pressure over recent months, with blockchain metrics beginning to validate this decline. The digital asset currently hovers around $79.50, confined within a price range that has remained intact since the beginning of the year.
Network participation on Solana has witnessed a consistent decline from approximately 3 million users in early 2025 to roughly 1.9 million presently. This represents a significant contraction in genuine platform engagement.
Decentralized exchange activity has similarly experienced a pronounced downturn from its earlier 2025 peaks. Daily volumes measured in billions have evaporated, with no signs of recovery emerging.
Derivatives Metrics and Network Indicators Show Weakness
Solana’s derivatives Open Interest has contracted from approximately $3 billion at its peak to around $2.1 billion currently. Market participants are reducing exposure and decreasing leveraged positions.
What stands out is the persistence of positive funding rates despite this backdrop. This indicates traders maintain a bullish directional bias even as underlying fundamentals deteriorate.

From a technical perspective, analyst Man of Bitcoin has identified a compression pattern developing on the four-hour timeframe. SOL is currently squeezed between descending resistance and ascending support trendlines, with a decisive move appearing imminent. The critical level he emphasizes: $68.02. A close beneath this marker would invalidate the constructive technical formation.
Should SOL break to the upside, initial resistance appears near $98, followed by additional targets at $110.54, $120.47, and $126.95.
Analyst CryptoCurb presented a macro weekly chart illustrating Solana constructing an extended consolidation pattern spanning 2024 through 2026. His ultimate price objective stands at $1,000, though this scenario requires confirmation above the current range’s upper boundary.
Unprecedented Monthly Candle Pattern Emerges
Crypto analyst Patel published an extensive analysis on X, highlighting an occurrence without precedent in Solana’s trading history: 8 consecutive monthly red candles.
He referenced the 2021 bear market period, when Solana plummeted from $260 down to $8. That selloff also generated 9 red monthly candles — though not in unbroken succession. The 9th candle signaled the cycle bottom, after which SOL rallied to establish a fresh all-time high around $295 throughout the subsequent two years.
Patel notes the 9th monthly candle is currently developing, and he’s monitoring the $80–$50 range as a probable accumulation zone. Should the previous cycle’s blueprint repeat itself, he anticipates SOL could pursue a new all-time high in the $500–$1,000 territory over the coming one to two years.
On shorter timeframes, liquidation analytics from Coinglass reveal concentrated short positions clustered between $83 and $87. If SOL advances into this zone, forced liquidations could catalyze rapid upward momentum.
Primary downside support remains anchored at $76. Primary upside catalyst lies within the $83–$87 short liquidation cluster.
Get 3 Free Stock Ebooks
Discover top-performing stocks in AI, Crypto, and Technology with expert analysis.
- Top 10 AI Stocks - Leading AI companies
- Top 10 Crypto Stocks - Blockchain leaders
- Top 10 Tech Stocks - Tech giants

