



Key Highlights
- Open interest in Solana futures contracts declined 30% during May, sliding from $2.75 billion down to $1.90 billion.
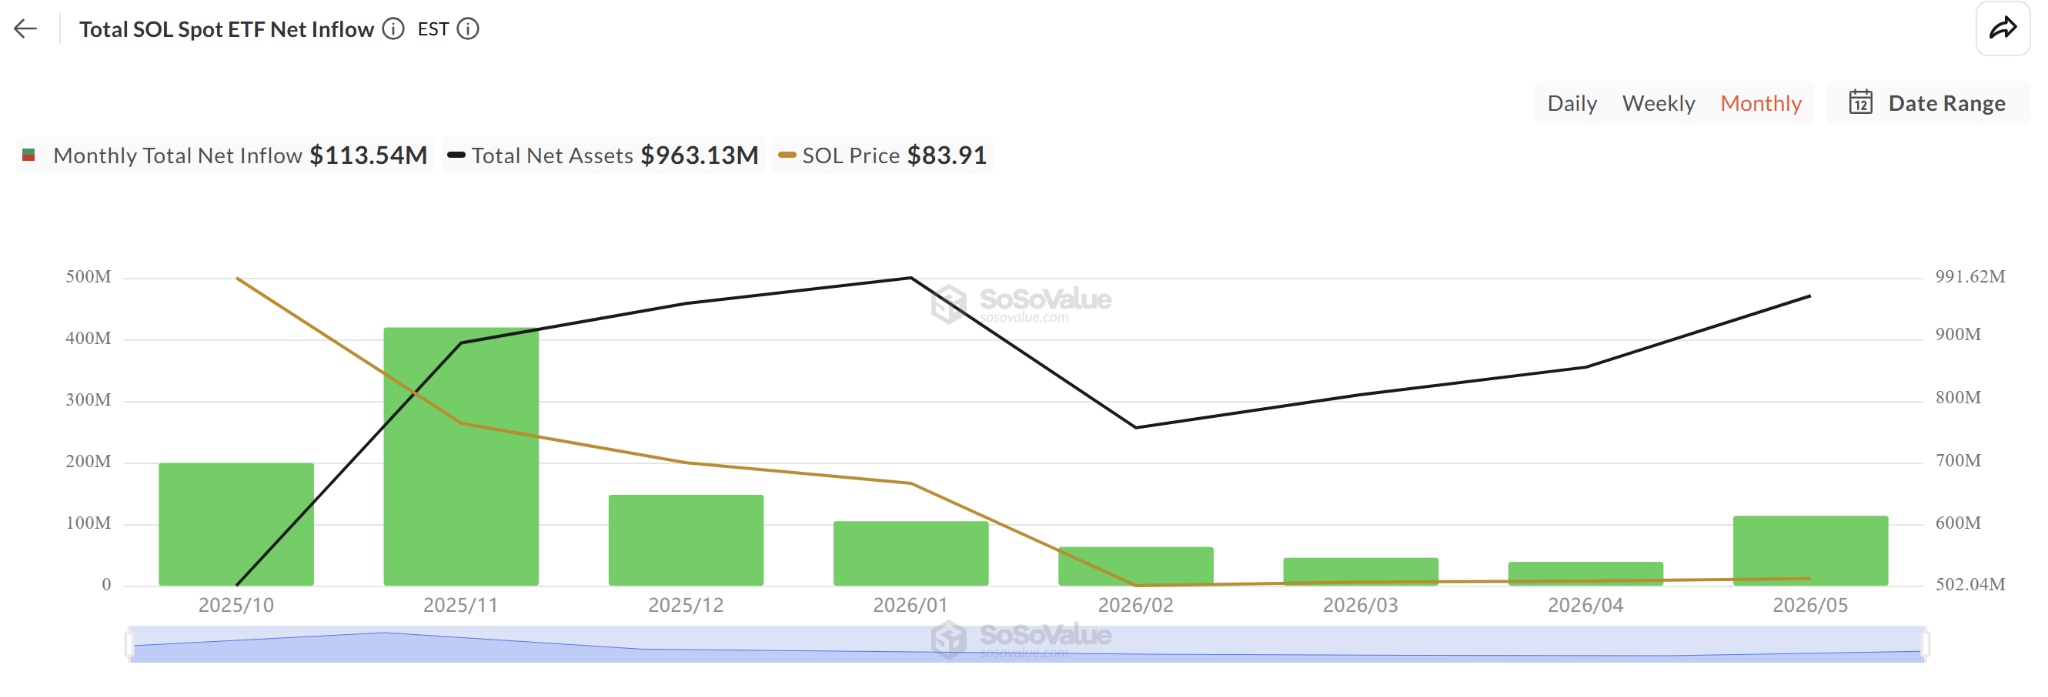
- Monthly inflows into SOL spot ETFs climbed to $113 million, marking the highest total seen in 2026.
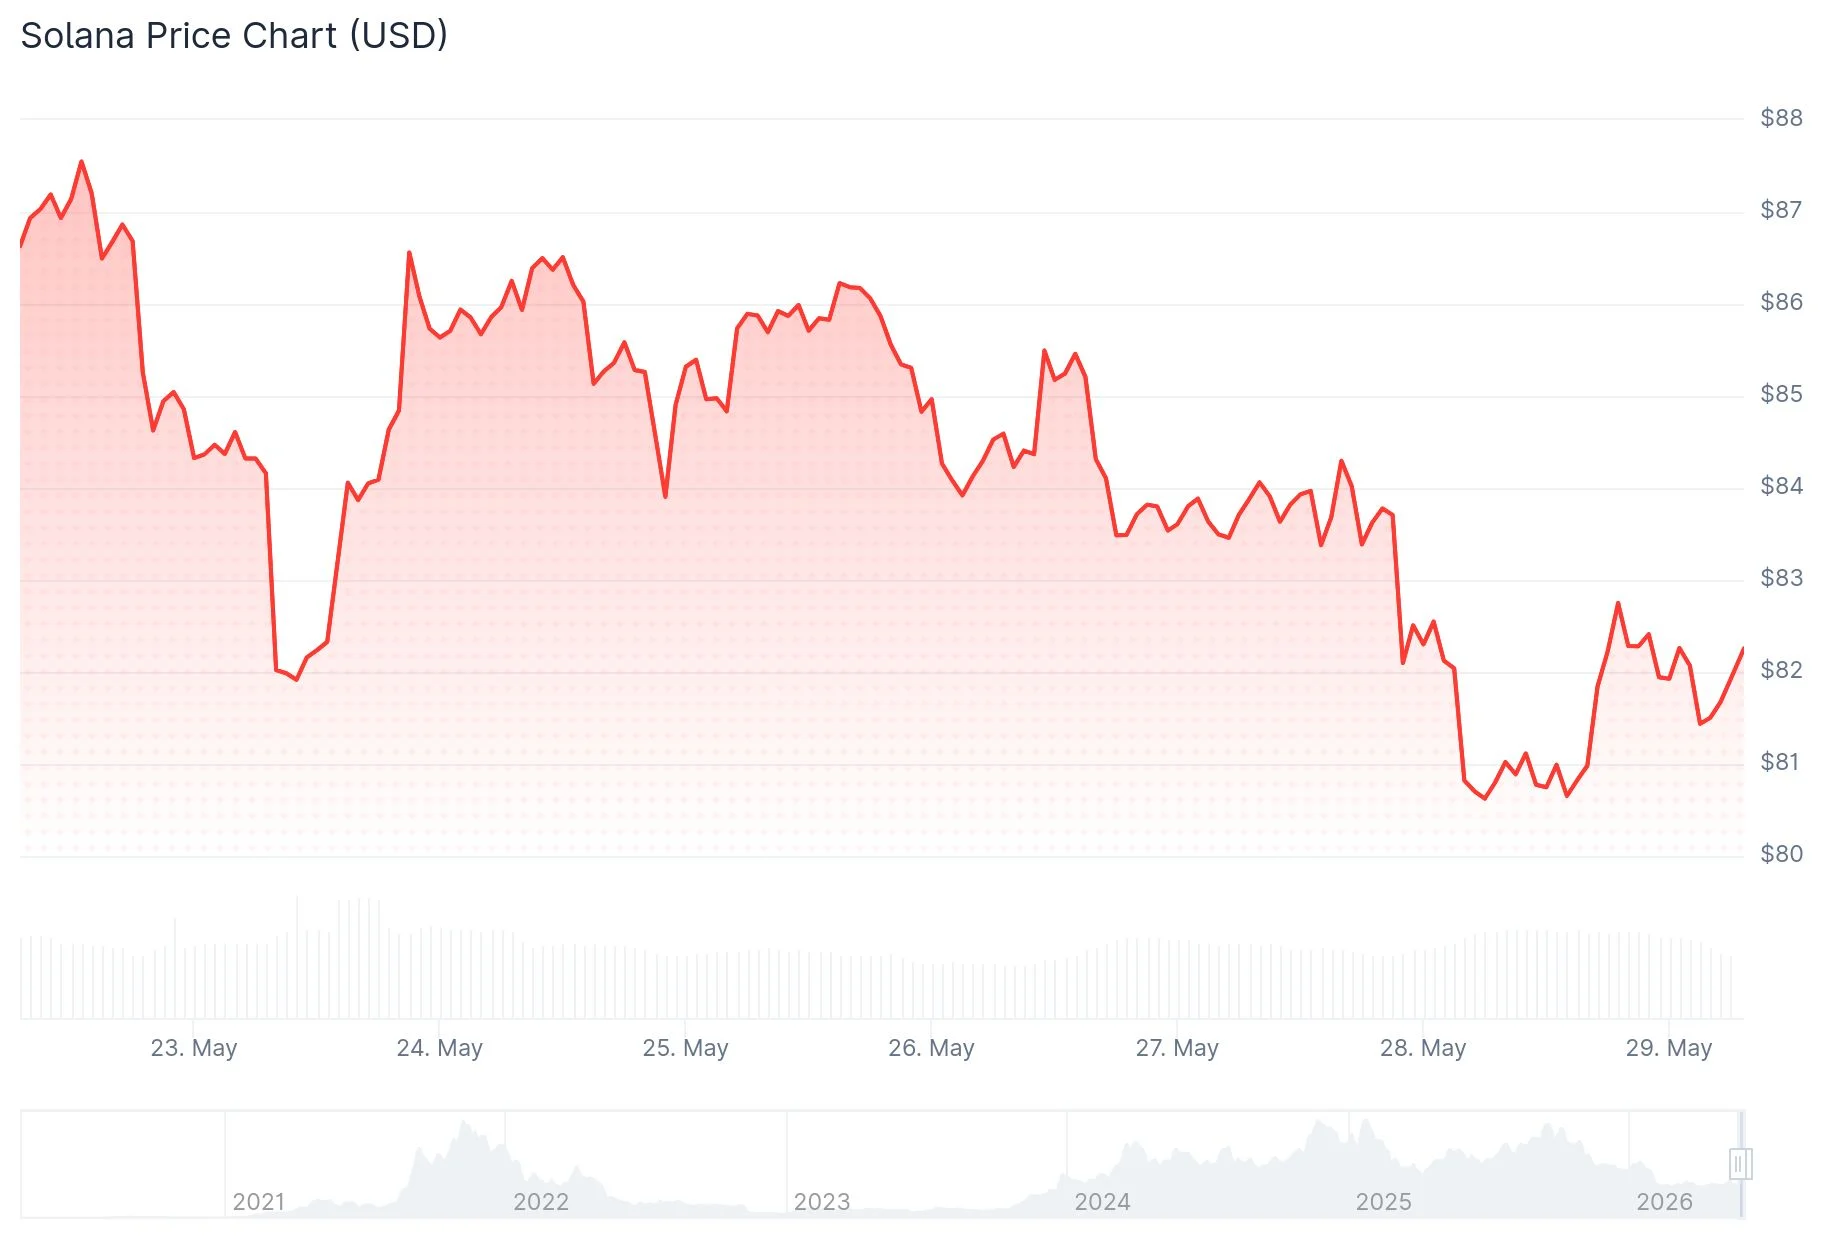
- Current trading activity centers around $80, forming the lower edge of a three-month consolidation zone stretching to $95.
- Should price action breach $80, attention shifts to the annual bottom near $68, where approximately $800 million in leveraged long positions face liquidation risk.
- Escalating geopolitical tensions involving the United States and Iran contributed to selling waves, momentarily dragging SOL to the $80 level.
Throughout May, Solana (SOL) experienced downward pressure as market participants reduced their leveraged positions amid declining risk sentiment across crypto markets. Price action dipped to $80 on Thursday during a widespread digital asset selloff sparked by news of military confrontations between the United States and Iran.
Across all trading platforms, total futures open interest contracted to $1.90 billion from $2.75 billion recorded on May 11, representing approximately a 30% reduction within just over two weeks. The combined funding rate remained anchored near -0.005, indicating that neither bullish nor bearish traders have established dominant directional positions despite recent price weakness.
The aggregate futures cumulative volume delta (CVD) for stablecoin-margined contracts sank to an annual low of -$13 billion, signaling persistent selling pressure within derivatives markets throughout the month of May.
Market analyst Sjuul from AltCryptoGems shared observations on X, stating that SOL “looks very weak,” highlighting the rejection encountered at $98 and the subsequent downward trajectory. He emphasized that critical price levels have converted into resistance zones, particularly $88, and suggested that movement toward the $76 support area remains probable if selling momentum persists. He further noted that bullish traders would need to recapture $88 to alter the current bearish outlook.
Spot Market Activity Shows Continued Accumulation Amid Futures Contraction
While futures markets displayed clear weakness, spot trading activity demonstrated greater stability. Spot CVD advanced to $350 million since March, illustrating that buyers on spot platforms continued absorbing available supply even as derivatives participants scaled back their exposure.

SOL spot ETF activity reinforced this divergence. Net capital inflows totaled $113 million throughout May, establishing it as the most robust monthly performance for SOL exchange-traded funds during 2026. The pairing of declining futures participation with sustained spot purchasing generally indicates diminished speculative enthusiasm rather than widespread market fear.
Cryptocurrency trader Cold Blooded Shiller characterized SOL as among the more vulnerable large-capitalization charts currently, observing that it has maintained a downtrend trajectory since October and possesses limited robust support beneath the $80 threshold.
Technical Picture Centers on $80 Support Zone
From a technical analysis perspective, Solana has remained confined within a trading corridor between $80 and $95 following a 42% decline during the first quarter. The lower boundary of this range faced renewed testing on both Wednesday and Thursday.
Perpetual futures funding rates have transitioned into negative territory, hovering around -0.0088% based on Coinglass data, suggesting short position holders maintain market control.
The Relative Strength Index is nearing oversold conditions, while the MACD indicator stays beneath its signal line, demonstrating that bearish momentum has yet to experience reversal. Near-term resistance is positioned at both the 50-day and 100-day simple moving averages.
Crypto market commentator Zoe positioned buy orders near $67, which corresponds with the yearly minimum and the most significant concentration of leveraged liquidation exposure visible on the open interest heatmap.
Over $800 million in cumulative long leverage positions cluster around the $68 zone. This level represents the critical threshold requiring monitoring should downward price pressure persist.
Get 3 Free Stock Ebooks
Discover top-performing stocks in AI, Crypto, and Technology with expert analysis.
- Top 10 AI Stocks - Leading AI companies
- Top 10 Crypto Stocks - Blockchain leaders
- Top 10 Tech Stocks - Tech giants


