
 Price Consolidates at $70 — Critical Breakout Levels to Watch")
Key Takeaways
- SOL maintains position around $70.67, testing a key descending resistance line
- Breaking through $80 resistance could unlock upside targets of $90 and $95
- Solana’s tokenized equity trading volume surged to a record $553 million daily
- Trader Michaël van de Poppe projects $120–$130 price targets for Q3/Q4 2026
- Technical formations on longer timeframes point toward potential $500 milestone if resistance levels yield
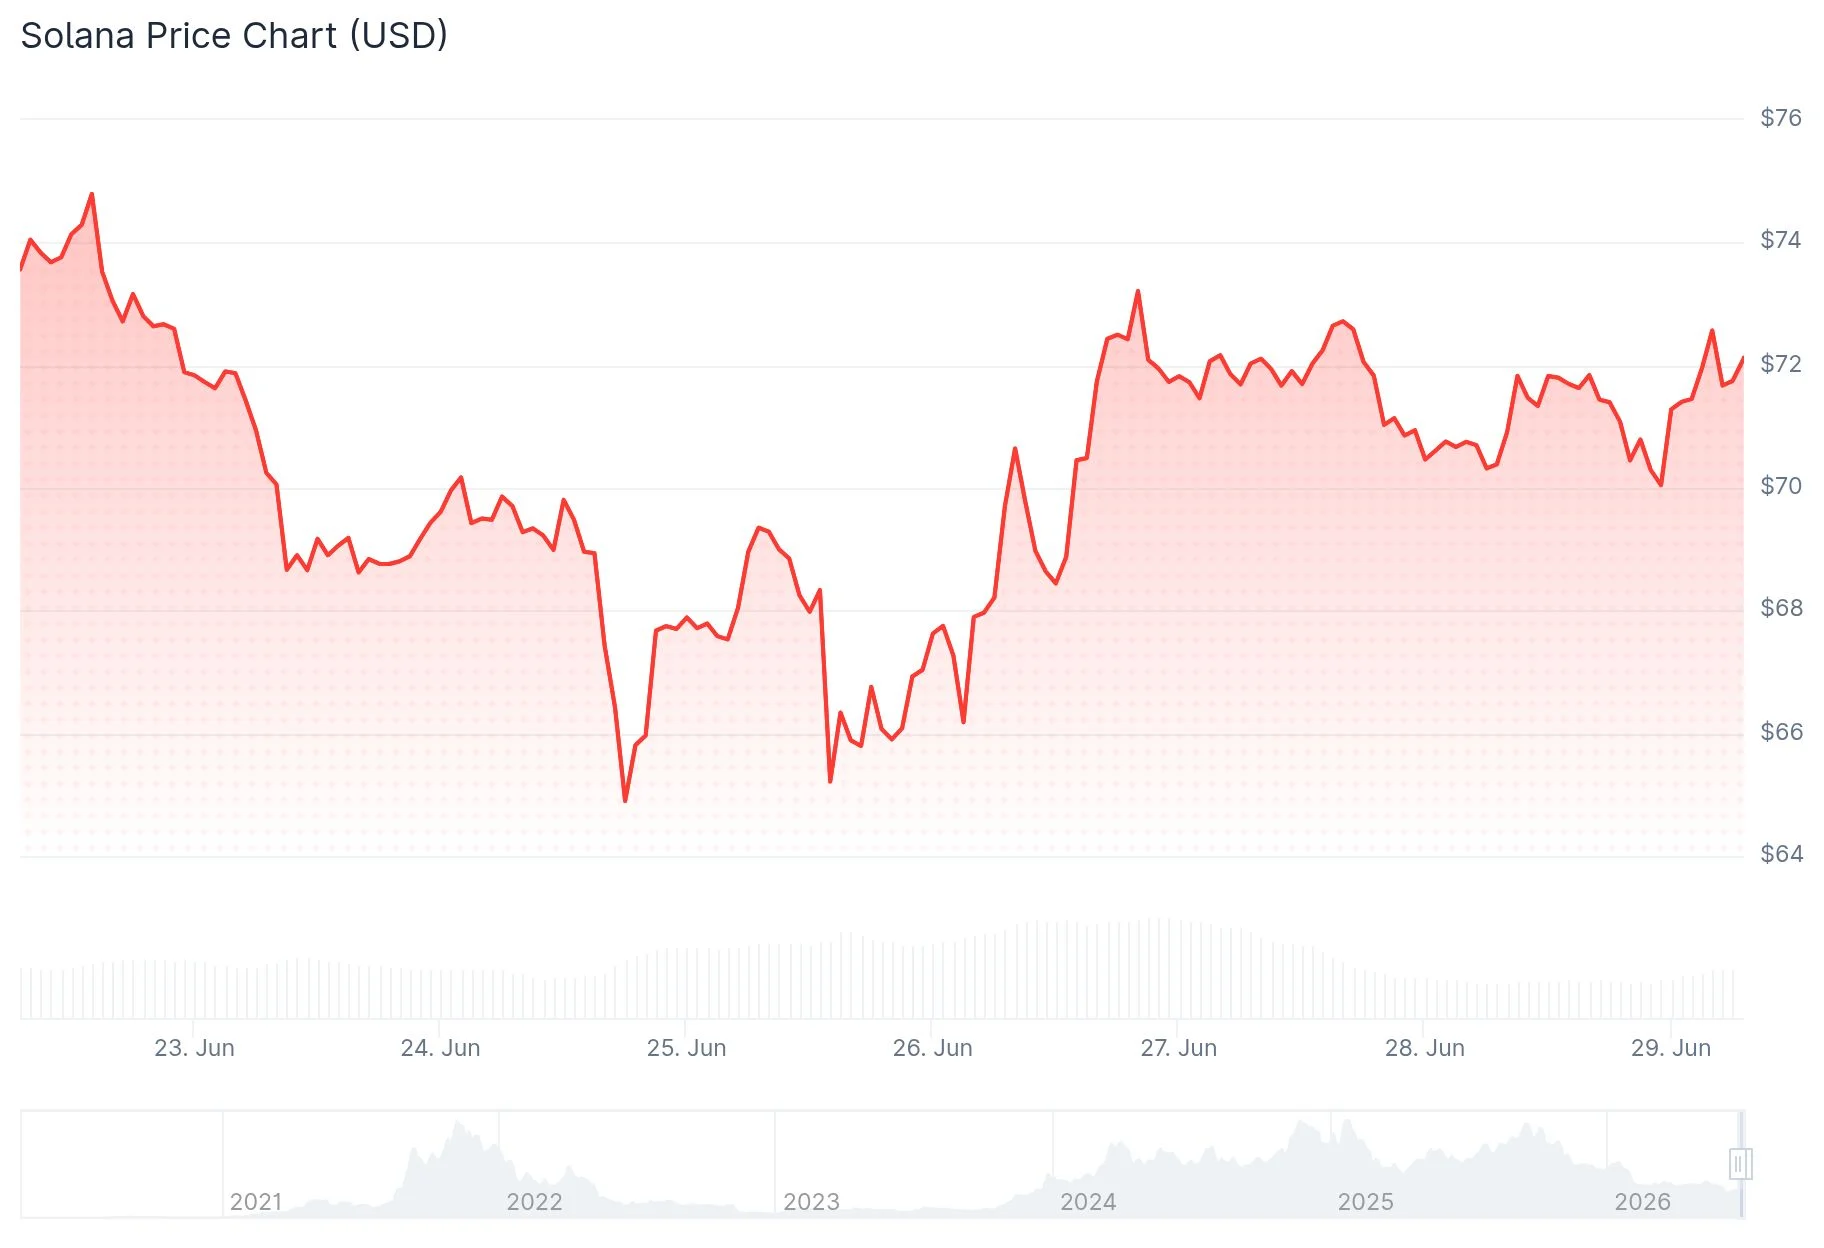
Solana is currently hovering around $70.67 as of June 29, 2026, experiencing a 1.82% decline over the past day. The digital asset maintains its position above the critical $70 support threshold, though buyers have yet to establish a definitive reversal pattern.
The crucial zone demanding attention spans $72–$75, where a downward-sloping resistance line currently resides. Bulls must recapture this territory before any substantial upward momentum can develop.
Should SOL push past $75, the subsequent resistance sits at $80. This represents the primary confirmation threshold market participants are monitoring closely.
A decisive close beyond $80 would tilt near-term dynamics in favor of buyers and establish $90 and $95 as viable targets. The $90 region aligns with notable overhead liquidity visible across technical charts.
Conversely, failing to defend the $70 mark could trigger a decline toward the $65–$60 range. A more pronounced downturn would reintroduce the $50 liquidity zone as a potential destination.

Trader Michaël van de Poppe shared his perspective on X, suggesting SOL appears positioned to reclaim its trading range. He noted that if this scenario materializes, the asset is unlikely to pause there, characterizing a range recapture as a straightforward buying opportunity. Van de Poppe further indicated expectations of $120–$130 as achievable targets during the third or fourth quarter of this year.
On-Chain Metrics Show Strength
Tokenized stock trading on Solana established a fresh daily volume milestone at $553 million. Market observer Whale Factor highlighted that Solana’s blockchain applications are diversifying well beyond speculative tokens and conventional cryptocurrency exchanges.
The real-world asset infrastructure on Solana now commands $3.18 billion in aggregate value distributed among more than 291,000 participants, positioning it as the leading blockchain measured by RWA holder participation.
Application-generated revenue on the network totaled $19 million in the past week and $85 million throughout the previous month. Decentralized exchange spot trading volume registered $12.3 billion over the weekly period.
Extended Timeframe Technical Formations
Market analyst JAVONMARKS identified a cup and handle configuration on the 12-day interval chart. A decisive move above the $260–$280 resistance band accompanied by robust volume would confirm this pattern, establishing an upside objective exceeding $500.
Analyst Crypto Patel has outlined a strategic accumulation plan for Solana within the $40–$60 range, with ambitious price objectives at $500 and $1,000. He drew parallels between the present correction and the 2022–2023 base formation that preceded the subsequent 2023–2024 advance.
An additional descending wedge formation remains intact on the broader timeframe chart, projecting a long-range target approaching $233 should SOL eventually escape this structure.
The daily interval chart requires a confirmed close above the descending trendline to validate the bullish scenario. The weekly MACD indicator has not yet generated a bullish crossover signal, according to analyst Dami-Defi.
SOL most recently changed hands at $71.44, reflecting a 0.43% decrease over the preceding 24 hours, based on Brave New Coin market data.
Get 3 Free Stock Ebooks
Discover top-performing stocks in AI, Crypto, and Technology with expert analysis.
- Top 10 AI Stocks - Leading AI companies
- Top 10 Crypto Stocks - Blockchain leaders
- Top 10 Tech Stocks - Tech giants

