


Key Takeaways
- Solana currently trades at $75.55, maintaining position above critical $73-$75 support range
- Exchange-traded funds recorded $10.26 million in net inflows during the previous week — extending positive flow streak to seven consecutive weeks
- Price action faces significant headwinds at the $78-$80 technical barrier
- Successful penetration above $78-$80 could trigger momentum toward $100 followed by $113
- Breakdown below $73 support would likely accelerate decline to $60-$61 zone
Solana (SOL) is currently valued at $75.55 as of Monday’s session, registering a modest 0.20% gain over the previous 24-hour period. The cryptocurrency maintains a market capitalization of approximately $44.03 billion, accompanied by daily exchange volume approaching $629 million.
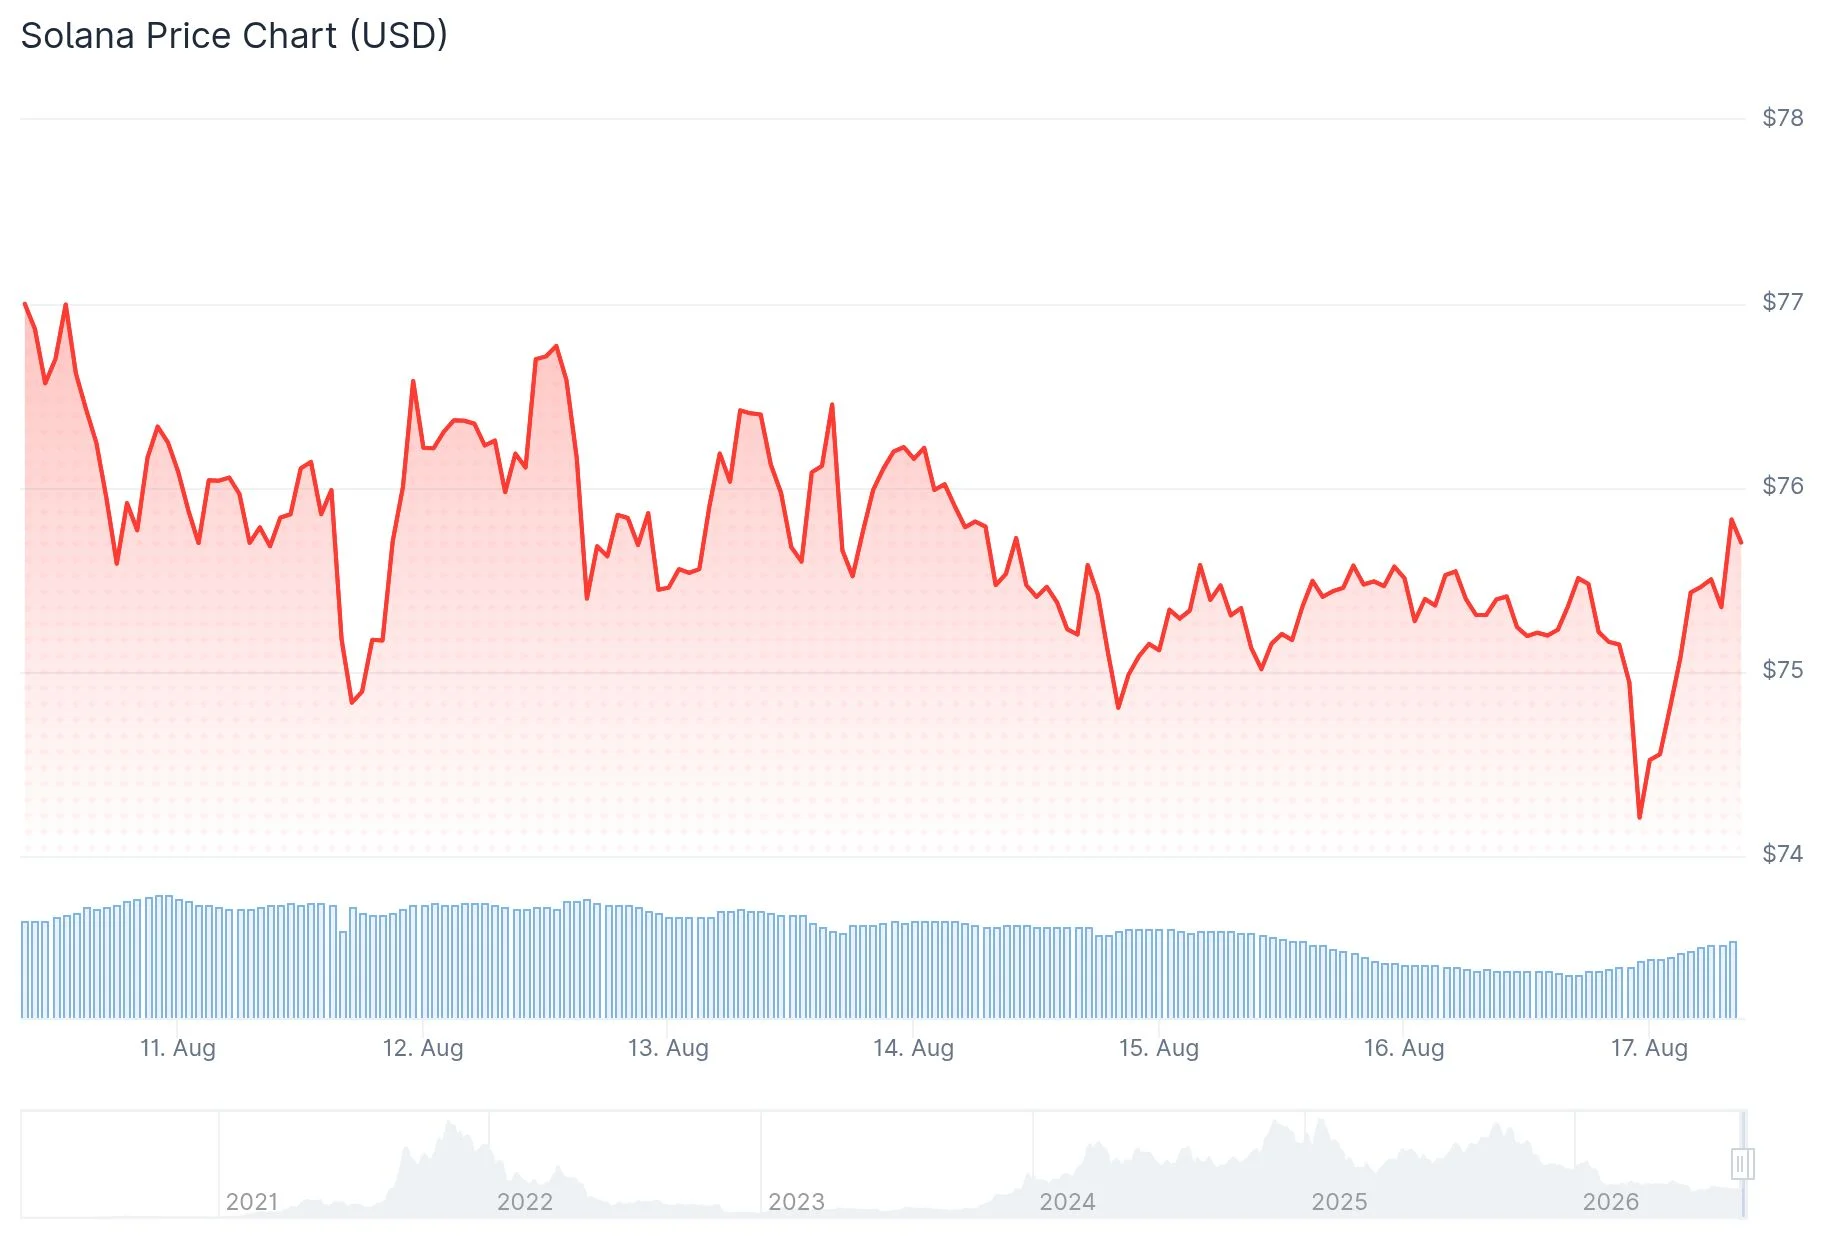
Despite experiencing a 2.18% weekly decline, SOL discovered buying interest along an upward-sloping trendline. The digital asset is now moving sideways immediately above the $73-$75 support band that market observers are monitoring attentively.
Investment from institutional participants has maintained consistency. According to SoSoValue tracking, Solana spot exchange-traded funds accumulated $10.26 million throughout the past week. This represents the seventh consecutive week of capital inflows and stands as the strongest weekly performance recorded since May 22.
Analysis from CryptoQuant indicates a moderately optimistic environment. Significant whale accumulation is evident in spot trading venues, whereas derivatives markets exhibit reduced activity levels. Additional on-chain indicators present neutral signals.
From a chart perspective, SOL is positioned marginally above its 50-day exponential moving average at $75.48. The asset continues trading beneath both the 100-day EMA at $78.10 and the 200-day EMA positioned at $88.69.

The Relative Strength Index registers near 52, reflecting equilibrium conditions. The MACD indicator remains in bullish territory, indicating some demand stabilization without generating definitive directional momentum at this stage.
Critical $78–$80 Barrier Comes Into Focus
Market analyst Alex Marzell highlights that SOL has encountered rejection at the $78-$80 range on numerous occasions. Every unsuccessful attempt at this level has resulted in downward pressure, establishing this zone as the critical near-term challenge for bullish participants.
Should distribution intensify and SOL surrender the $73 threshold, Marzell pinpoints $60-$61 as the subsequent substantial support destination.
Analyst Astekz characterized recent movement as erratic yet structurally constructive. SOL is working to escape from a downward-sloping trendline while preserving its horizontal support foundation.
Analyst Eliz observes that SOL is positioned above the Ichimoku Cloud formation on the 4-hour timeframe, which reinforces the ongoing consolidation above the $73-$75 breakout region.
Extended Price Projections
Analyst ray has detected a symmetrical compression formation on the Solana chart. A validated breakout from this configuration points to approximately $113, with $100 serving as the initial significant psychological milestone.
Cryptocurrency analyst KillaXBT mentioned on X that following Bitcoin’s base formation, a 100–150% advance for SOL is “absolutely in play,” although he refrained from guaranteeing new record peaks.
Looking further ahead, analyst Sweep anticipates SOL could reach approximately $200 by 2027. This projection incorporates expectations for enhanced regulatory frameworks, expansion in tokenized real-world assets, stablecoin ecosystem development, and sustained Solana memecoin engagement.
The technical chart Sweep presented highlights $179 as a mid-range Fibonacci checkpoint preceding a broader $212 target territory.
SOL presently exchanges hands at $75.55, with the $78-$80 overhead resistance and $73 underlying support representing the two critical thresholds commanding trader attention in the immediate term.
Get 3 Free Stock Ebooks
Discover top-performing stocks in AI, Crypto, and Technology with expert analysis.
- Top 10 AI Stocks - Leading AI companies
- Top 10 Crypto Stocks - Blockchain leaders
- Top 10 Tech Stocks - Tech giants


