


Key Takeaways
- Solana has triggered a bullish 3-day SuperTrend signal for the first time since October 2025, indicating a possible momentum shift
- Network expansion continues with 1.6 million fresh addresses created in just two weeks, according to Ali Charts
- Top traders on Binance maintain a bullish stance with a 1.89 Long/Short Ratio and 65.45% long positioning
- The critical $84 resistance zone stands between current levels and the next upside targets of $90 and $100
- Weekly timeframe reveals bullish RSI divergence, hinting that the correction cycle could be concluding
Solana appears to be entering a new phase as a crucial technical indicator has turned positive following months of bearish pressure. This development arrives after an extended downturn that pushed SOL to the $60 level in June.
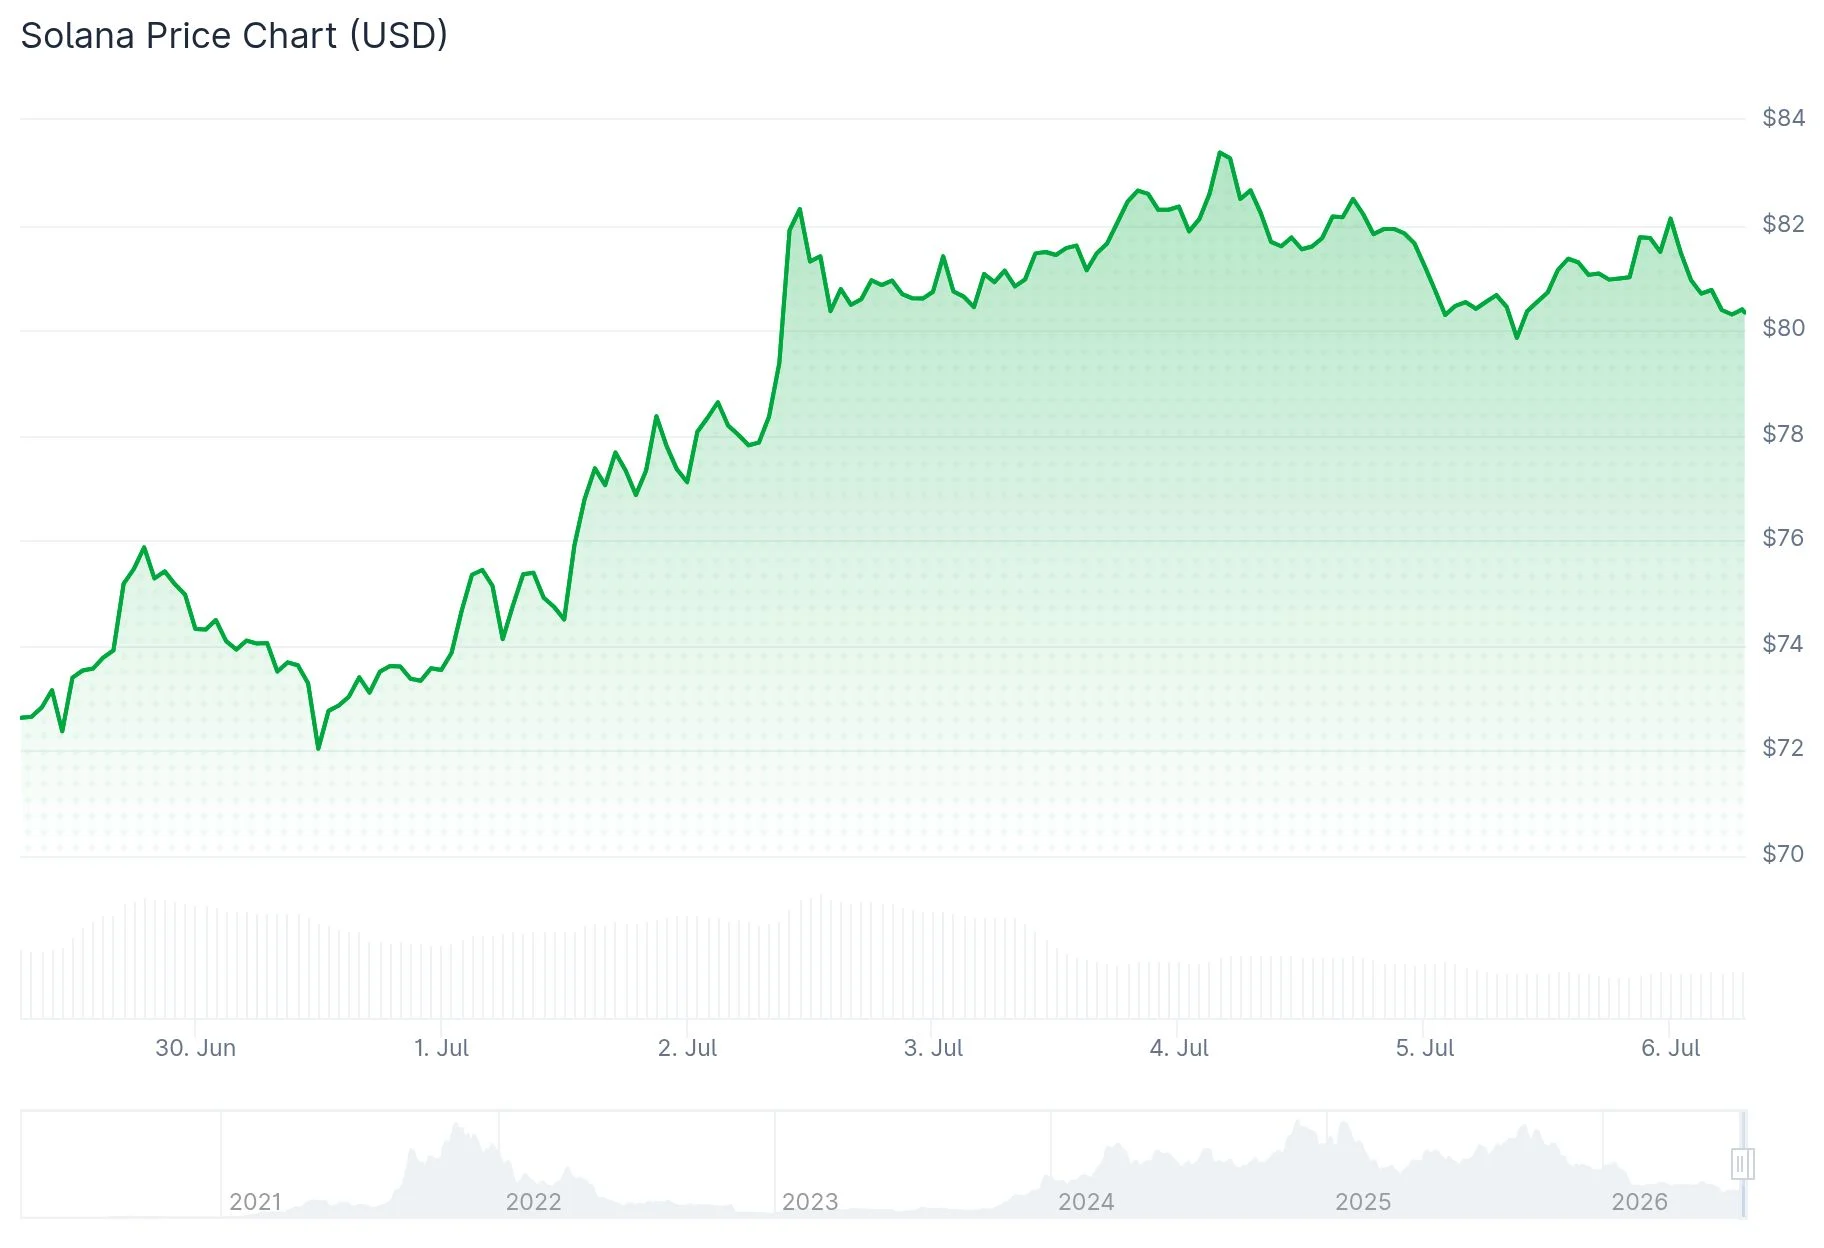
For the first time since October 2025, the 3-day SuperTrend indicator has issued a buy signal. Given that the prior sell signal coincided with a substantial 74% decline, market participants are paying close attention to this latest technical development.
Crypto analyst Ali Charts highlighted this signal on X, noting that the SuperTrend’s position beneath current price action suggests accumulating bullish pressure. This indicator leverages average true range calculations to identify trend shifts, and a flip below the price typically indicates strengthening buyer momentum.
In a follow-up observation, Ali Charts revealed that Solana’s network has welcomed 1.6 million new addresses in the last fortnight alone. Such expansion in network participation often correlates with increased ecosystem engagement and broader market interest.
Institutional Trader Sentiment
Binance’s elite traders are displaying strong bullish conviction. According to CoinGlass analytics, long positions represent 65.45% of monitored accounts, while shorts account for just 34.55%. This translates to a Long/Short Ratio of 1.89.

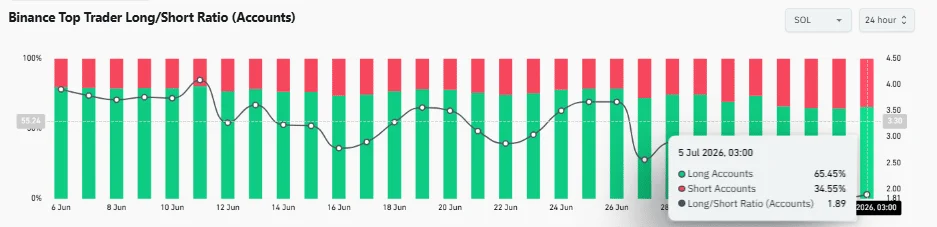
Notably, these sophisticated market participants have maintained their long exposure even as SOL rebounded from its June底s. This sustained positioning indicates confidence in further appreciation among institutional traders.
The OI-Weighted Funding Rate currently registers at a positive 0.0027%, indicating that leveraged long traders are compensating shorts. Throughout the recent price recovery, funding rates have remained constructively positive without reaching excessive levels that would suggest speculative froth.
Critical Resistance and Support Zones
SOL is presently challenging the $84 resistance barrier. Bulls have successfully defended the $78.07 support zone, preserving the constructive near-term price structure.
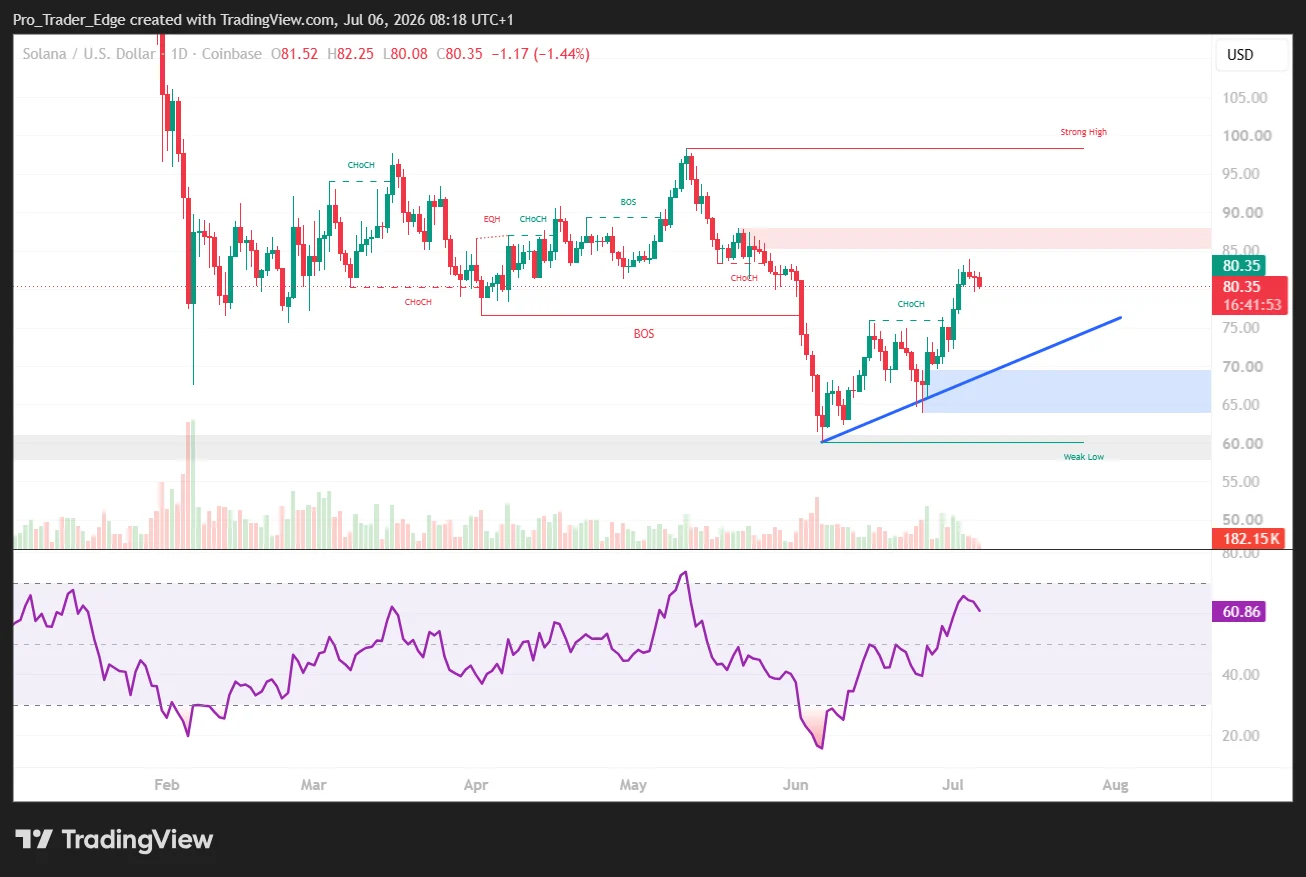
The daily Relative Strength Index reads 61.20, while its Moving Average stands at 52.66. Both metrics reflect sustained buying interest above neutral territory.
A decisive break above $84 would likely clear the path toward $90. However, failure to overcome this barrier could trigger a retest of the $78.07 support level.
On the weekly timeframe, technical analyst TraderJB has identified bullish RSI divergence forming near what he identifies as the conclusion of a wave C correction pattern. He observed that similar divergence—though in the opposite direction—materialized at the prior peak before the correction initiated.
TraderJB characterized the present zone as offering favorable risk-reward dynamics for spot accumulation, provided the Elliott Wave count proves accurate.
Solana’s immediate challenge remains breaking through the $84 resistance level decisively, with subsequent upside objectives at $90 and potentially $100 should the current bullish structure hold.
Get 3 Free Stock Ebooks
Discover top-performing stocks in AI, Crypto, and Technology with expert analysis.
- Top 10 AI Stocks - Leading AI companies
- Top 10 Crypto Stocks - Blockchain leaders
- Top 10 Tech Stocks - Tech giants


