
 Rallies 3% as SpaceX Tokenization Debuts On-Chain — Critical Levels Ahead")
Key Highlights
- SOL advanced 3.38% to reach $67.73, pushing weekly performance above 4%
- Tokenized SpaceX product SPCX went live on Solana through Backpack and Sunrise platforms
- Price had declined 36% from May’s $96 peak before recovering more than 10% from June’s bottom
- Critical resistance level identified at $68, with $72.57 marking potential bullish confirmation
- Technical analyst Crypto Patel highlighted SOL’s position in the Fibonacci zone that previously sparked a 2,200% surge
Solana (SOL) is currently valued at $67.73 following a 3.38% increase over the last 24-hour period, based on CoinMarketCap statistics. The altcoin has accumulated weekly returns exceeding 4% as buyers re-entered the market.
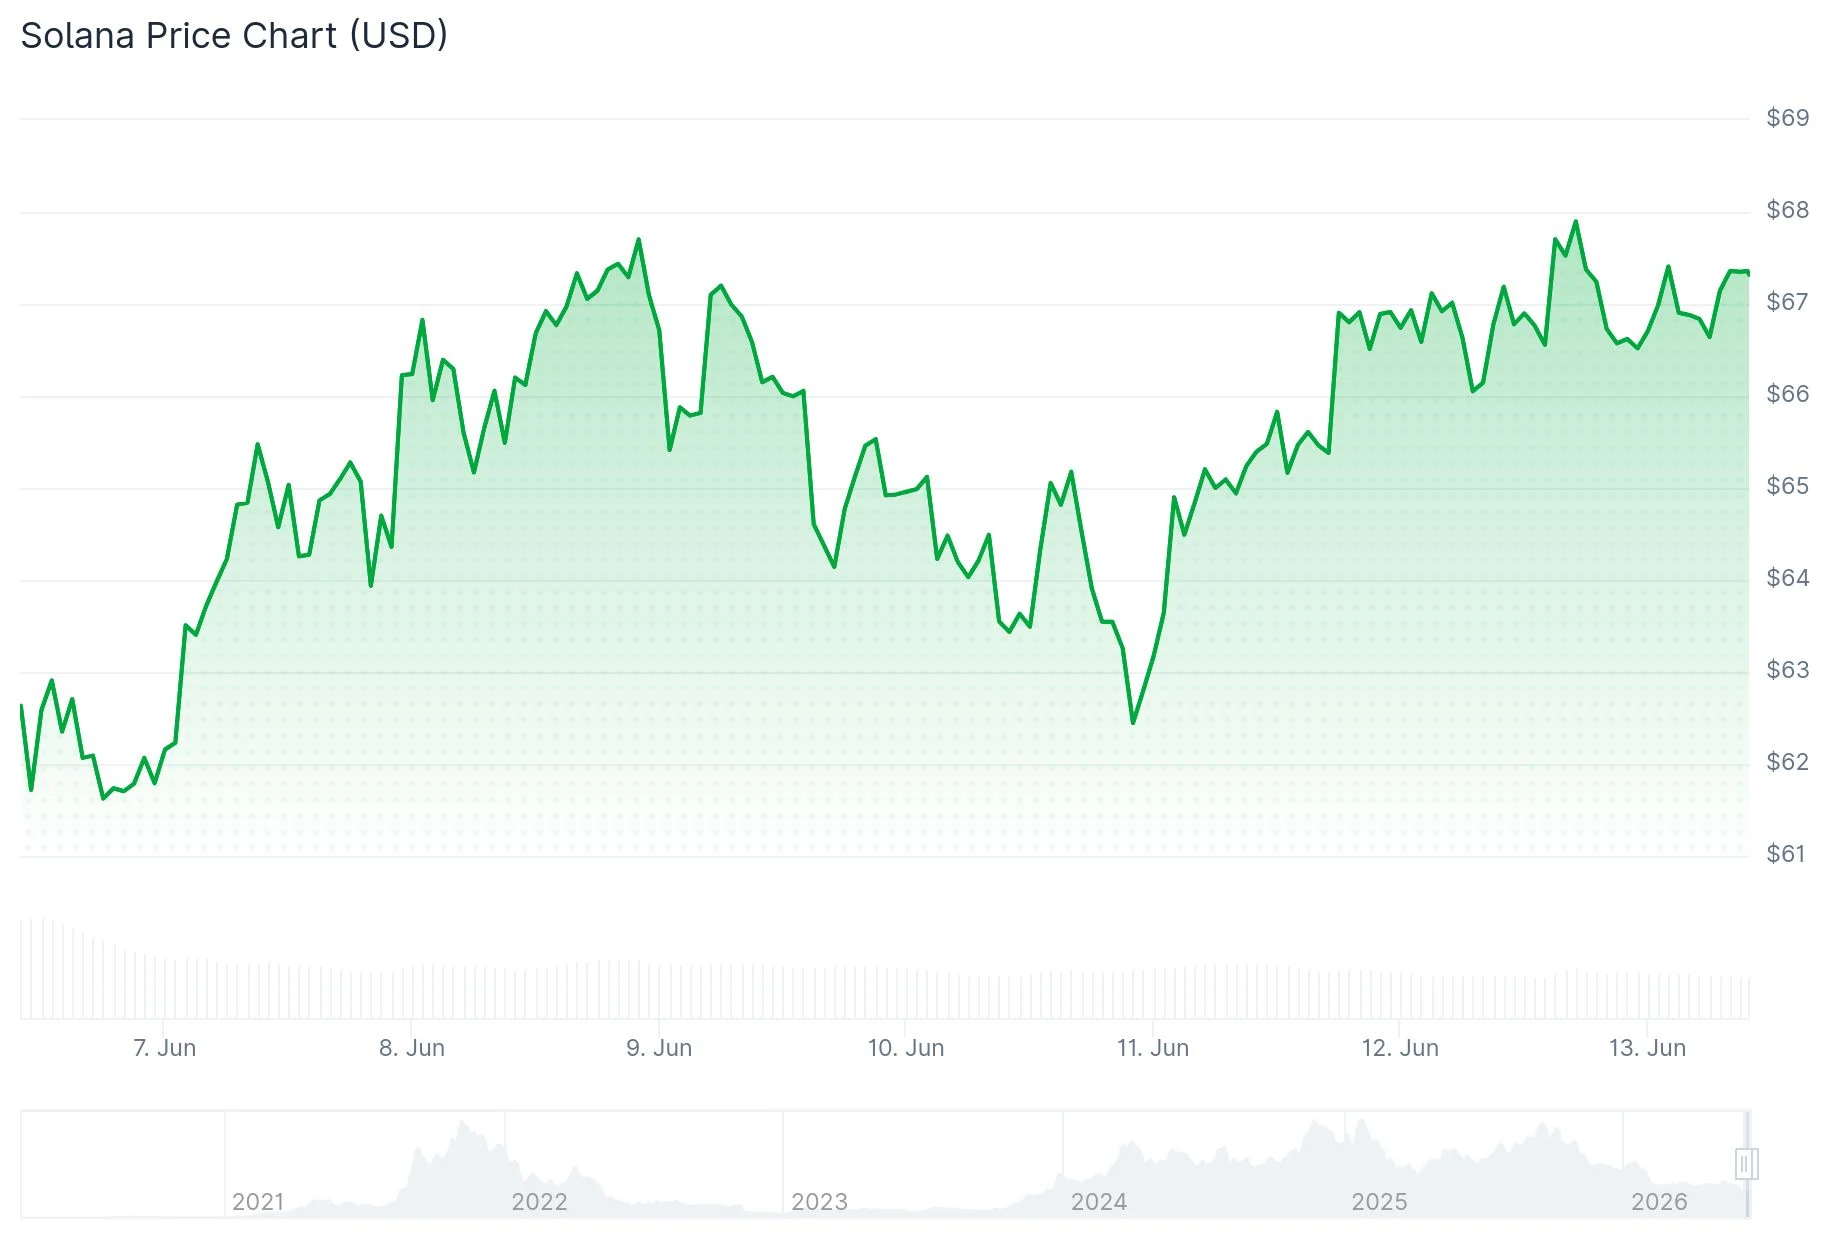
Trading began around the $65.30 level before SOL advanced toward an intraday high of $68.50. Although the asset experienced minor profit-taking, it maintained the majority of its upward movement, closing the period near $67.73.
This upward momentum represents a rebound from significant losses. The token tumbled approximately 36% from its May peak around $96 down to a June 6 floor of roughly $61. This downturn resulted in over $89 million worth of forced long position closures as leveraged traders faced liquidation.
Retail market participants had positioned themselves bullishly entering June, leaving them vulnerable when SOL breached the $76 support threshold. Whale activity also showed reduced holdings throughout the correction, contributing additional downward pressure.
SpaceX Equity Enters Blockchain Through SPCX
A significant catalyst this week involved the introduction of SPCX, a blockchain-based instrument representing SpaceX equity. The Backpack and Sunrise platforms collaborated to deploy this offering on Solana, enabling qualified participants to acquire, exchange, and maintain custody of tokenized SpaceX ownership stakes.

Token holders maintain the option to exchange their SPCX holdings for conventional equity certificates via approved brokerage intermediaries. This development aligns with SpaceX’s Nasdaq listing, creating parallel markets for both blockchain-based and traditional share trading.
The introduction strengthens Solana’s position in real-world asset tokenization, establishing the network as a prominent platform within the expanding tokenized securities ecosystem.
Market analyst Crypto Patel observed on X that SOL currently occupies the 0.5–0.618 Fibonacci retracement territory — identical to its position before generating a 2,200% explosive rally during a previous market cycle. Patel posed whether SOL might achieve $1,000 should altcoin momentum return, identifying the $40 to $60 range as the primary accumulation window.
Chart Patterns Suggest $76 Objective
Examining the daily timeframe, Solana has constructed a falling wedge formation since reaching its January summit near $145. Chart specialists typically interpret this configuration as a bullish continuation pattern when price action consolidates along the lower trendline.
The four-hour chart reveals an ascending triangle developing underneath the $68 barrier. A decisive move above this threshold could force short covering and propel price toward $70, with the pattern’s measured projection targeting approximately $76.
Market analyst MCO Global stated on X that legitimate bullish confirmation demands a five-wave impulse sequence coupled with penetration above $72.57, commenting: “The price structure hasn’t demonstrated this yet. Until that confirmation arrives, we’re simply witnessing support zone testing.”
The daily Relative Strength Index has climbed out of oversold conditions, while MACD momentum indicators show declining bearish pressure. SOL’s immediate challenge remains conquering the $68 resistance barrier.
Get 3 Free Stock Ebooks
Discover top-performing stocks in AI, Crypto, and Technology with expert analysis.
- Top 10 AI Stocks - Leading AI companies
- Top 10 Crypto Stocks - Blockchain leaders
- Top 10 Tech Stocks - Tech giants

