



Key Highlights
- SOL hovers near $85.40, reflecting a 0.5% decline over 24 hours
- Current positioning sits beneath all significant EMAs, indicating bearish momentum
- $86.61 represents the crucial near-term resistance zone
- Market observers identify $100 as initial recovery milestone, with extended targets reaching $300–$500
- Trader Mei-Lin continues accumulating SOL with projections of $250, $460, and $800
Solana has remained confined within a constrained trading corridor throughout the previous week, showing limited indication of a definitive directional shift. The digital asset has oscillated between $81.92 and $87.68 during this seven-day window, encountering consistent resistance as each upward attempt meets selling activity around near-term barriers.
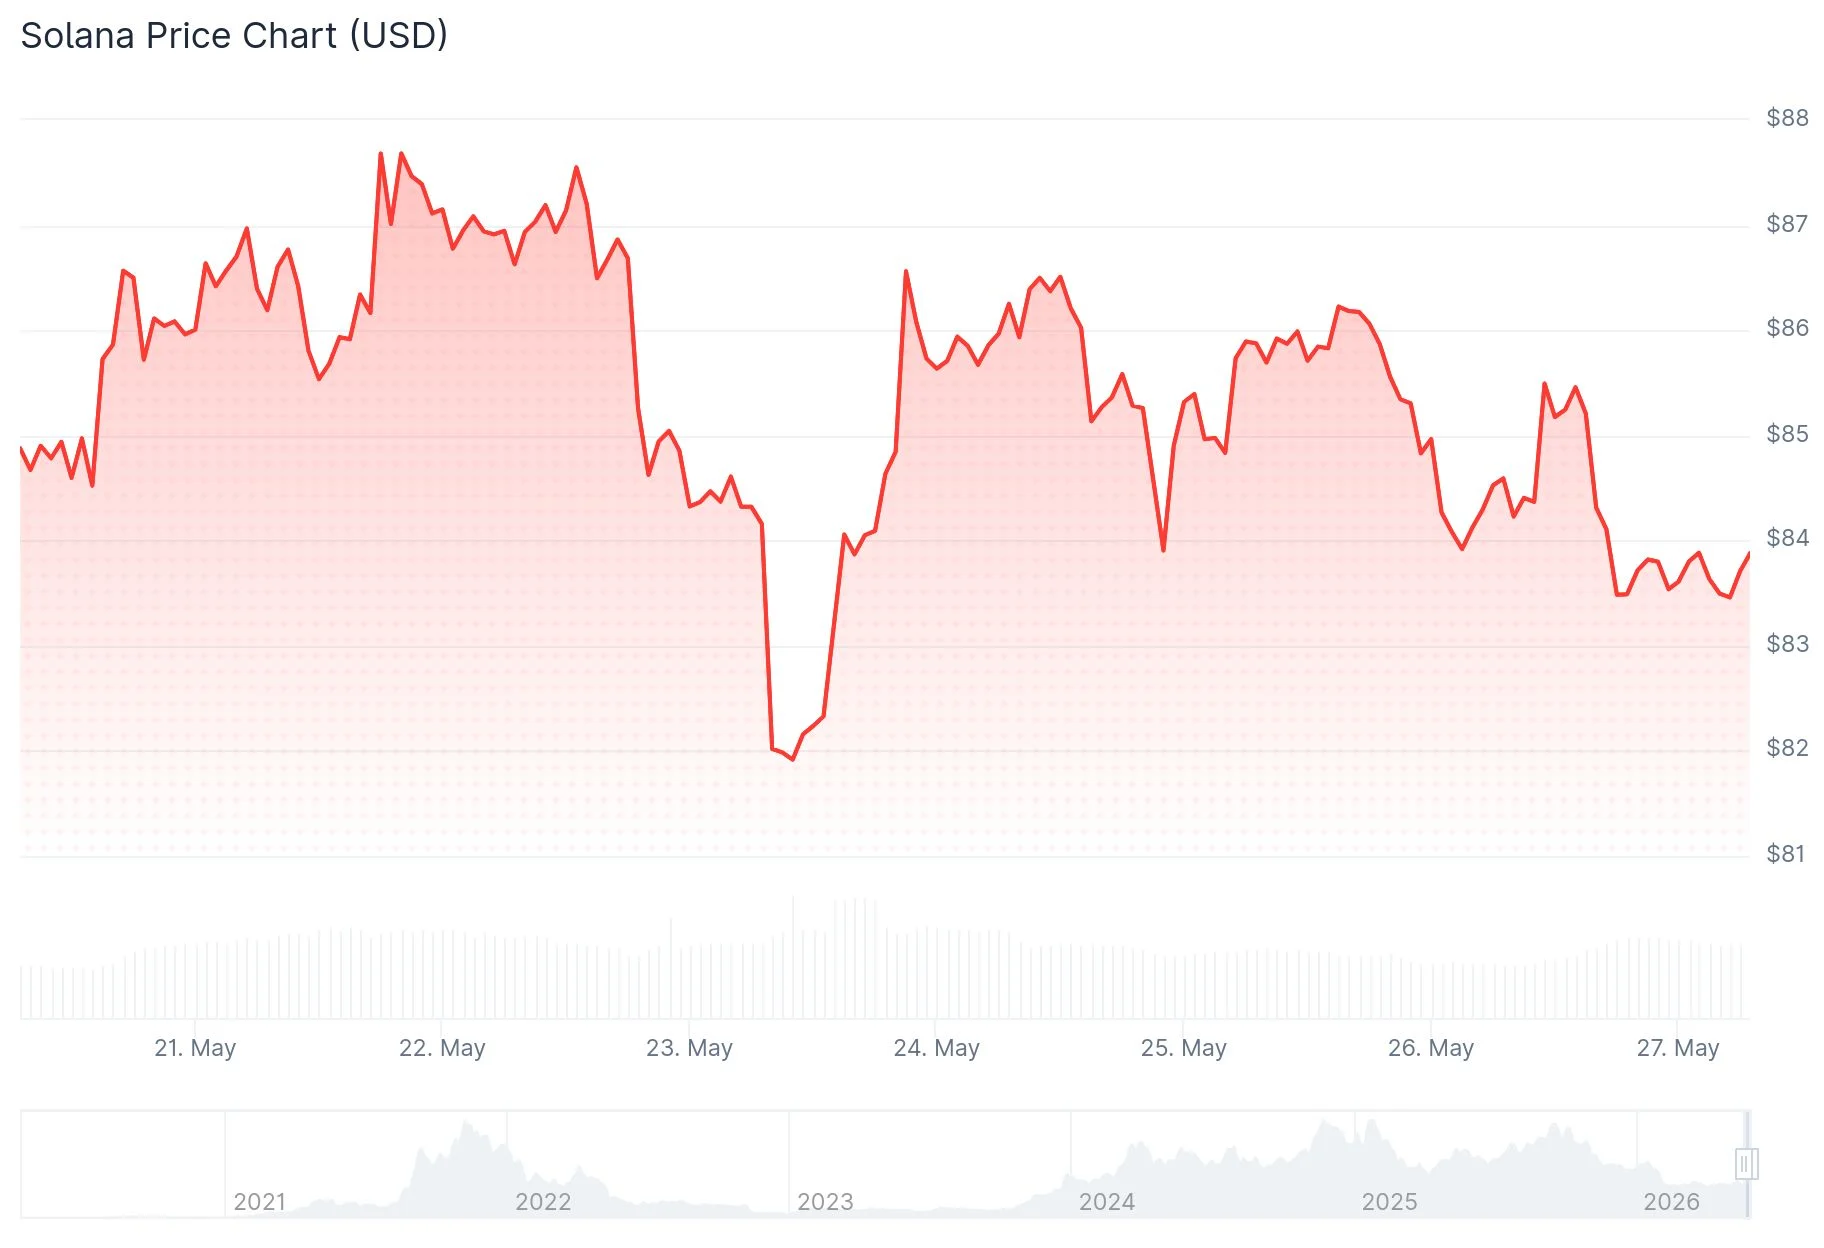
As of the latest update, SOL was changing hands around $85.40, representing a 0.5% decrease throughout the preceding 24-hour period.
The token momentarily recaptured the $86 threshold but failed to sustain momentum above this mark. This configuration has emerged repeatedly in recent sessions, maintaining Solana within a compressed range while preventing any definitive trend from materializing.
Bearish Technical Positioning Dominates
Solana currently resides beneath its 10, 20, 50, 100, and 200-day exponential moving averages. This configuration transforms each of these technical indicators into overhead resistance instead of underlying support.
Positioning below the 200-day EMA generally indicates that extended-timeframe momentum maintains a bearish orientation. Solana’s inability to recapture this threshold preserves the overarching technical framework with a downward bias.

The 14-day RSI registers at 45.59, positioning it within neutral range. The weekly RSI reading, conversely, stands at 38.64, landing in oversold conditions and demonstrating prolonged distribution pressure across an extended timeframe.
The immediate pivot point to monitor is $85.26. Beyond this marker, $86.61 emerges as the critical threshold SOL must decisively surpass to unlock momentum toward $88.43. Conversely, a decline beneath $85.26 would expose underlying support around $83.34, followed by the $82 zone.
Cryptocurrency trader Mei-Lin has maintained focus on SOL and reports ongoing accumulation at prevailing price levels. “We’re currently in a strong range on the daily chart; we’re likely gearing up for the next bullish wave,” she posted on X. Her near-term projections include $250, $460, and $800.
Market Observers Focus on $100 as Critical Threshold
Multiple technical perspectives highlight $100 as the pivotal level capable of transforming the trajectory for Solana.
Trader CryptoCurb published technical analysis illustrating Solana approaching a descending resistance trendline following base formation. A convincing breakout above this trendline would redirect attention toward $100 as the subsequent upside objective. CryptoCurb drew parallels to NEAR’s recent price structure, which demonstrated comparable formation before initiating upward movement.
Analyst Borovik notes SOL has remained contained beneath $100 throughout a four-month period. He anticipates movement above $300 when broader cryptocurrency market momentum resumes, with $500 staying achievable within a twelve-month horizon. This outlook, however, hinges completely on SOL initially reclaiming $100.
Should purchasing activity drive SOL beyond $100, subsequent reference levels would emerge around $125, $150, and $175. Presently, Solana maintains consolidation within the $80 to $90 corridor.
Get 3 Free Stock Ebooks
Discover top-performing stocks in AI, Crypto, and Technology with expert analysis.
- Top 10 AI Stocks - Leading AI companies
- Top 10 Crypto Stocks - Blockchain leaders
- Top 10 Tech Stocks - Tech giants


