



Key Highlights
- Ripple’s XRP maintains position above $1.50 mark with 2.73% daily gain, holding critical support.
- Binance token reserves decline to 2.69 billion, suggesting reduced selling pressure from exchanges.
- Critical resistance zone identified between $1.53-$1.60, with upside targets at $1.65-$1.70.
- Technical indicators show RSI at 58 with positive MACD, indicating moderate bullish sentiment.
- Market analysts highlight $1.45 and $1.246 as crucial support levels if downside momentum builds.
Ripple’s XRP reclaimed territory above the $1.50 threshold on Tuesday as buying interest reinforced a critical support area. The digital asset was changing hands around $1.52, marking a 2.73% increase during the 24-hour trading window. Daily trading volume reached $4.55 billion across exchanges.
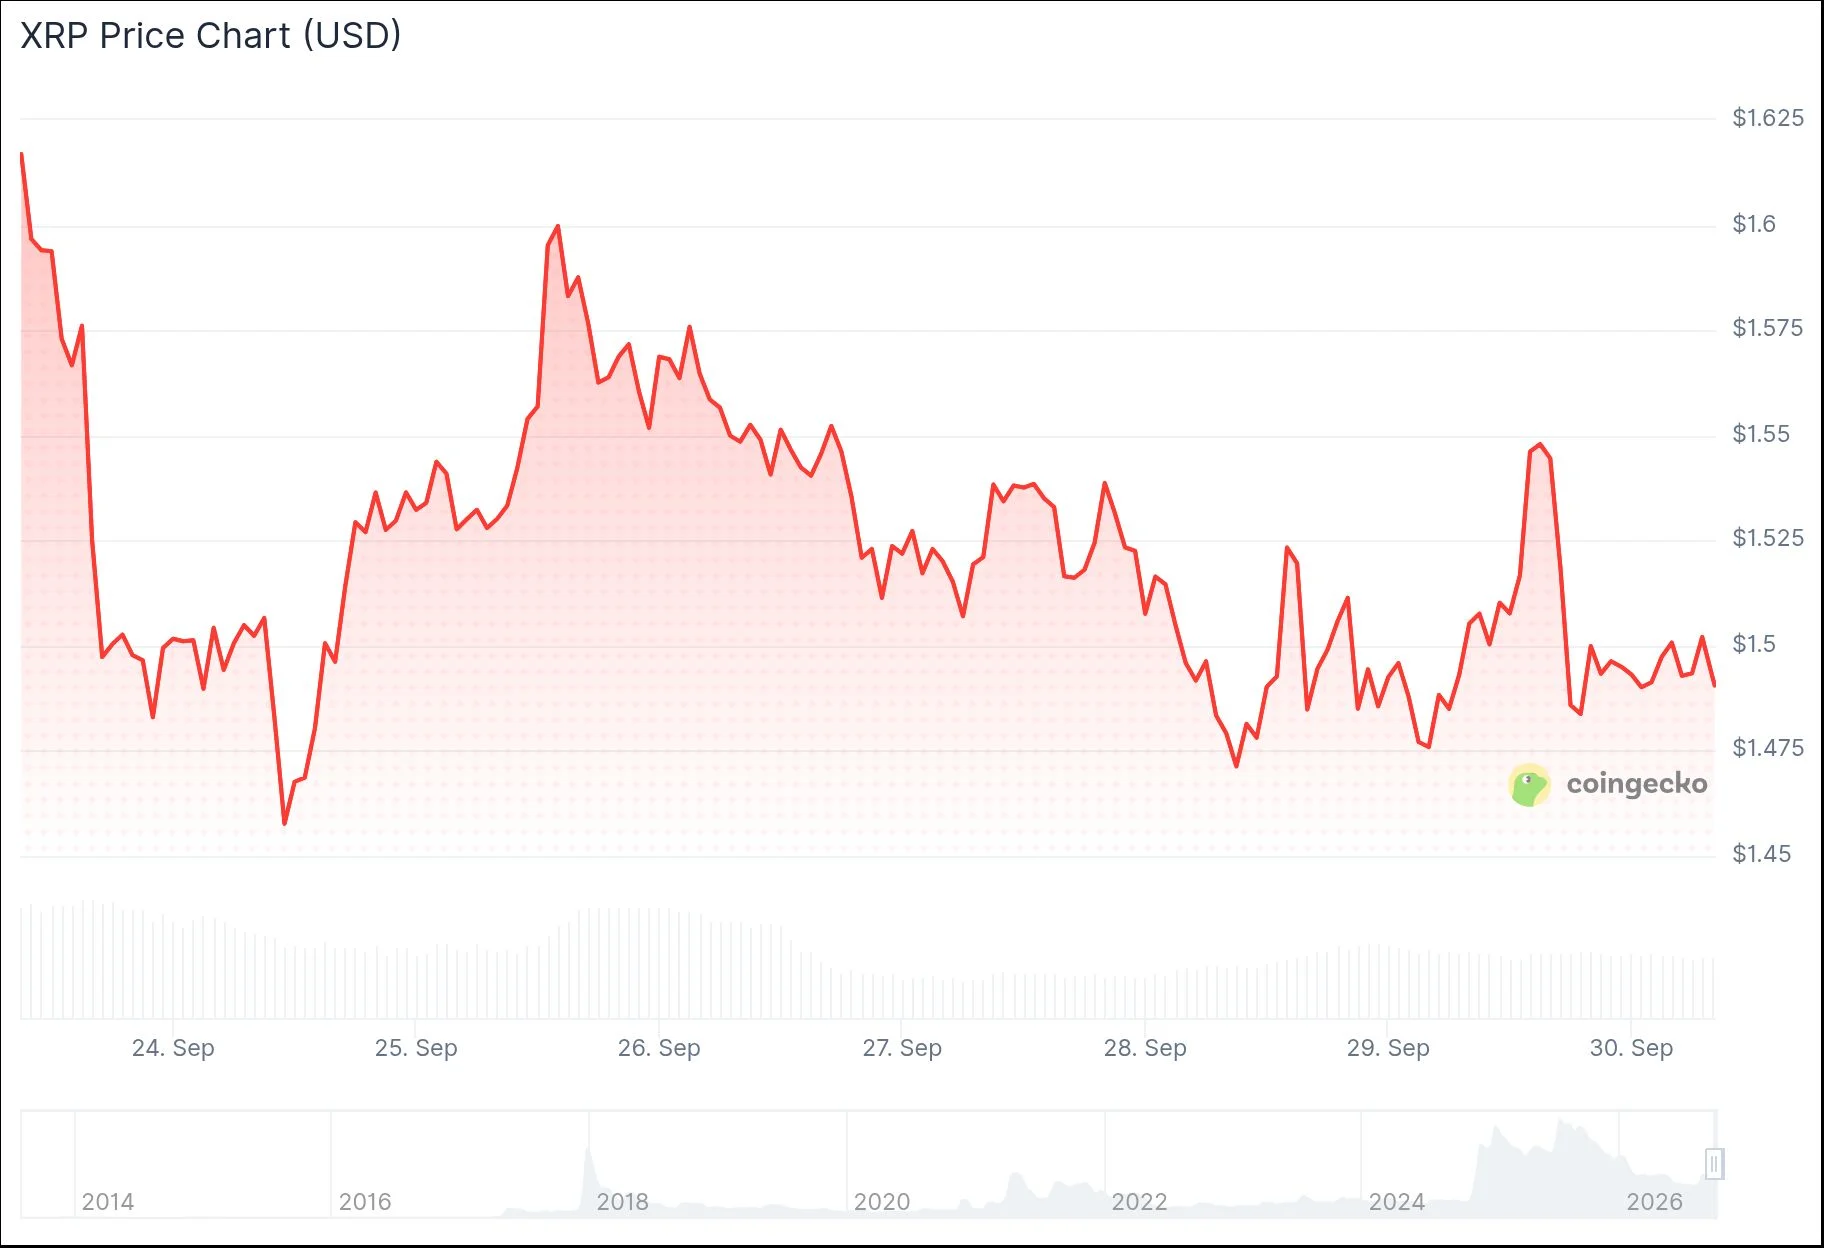
The token’s total market valuation stood at $95.68 billion, per CoinMarketCap tracking data. Despite the recent uptick, XRP remained down 3.66% across the seven-day timeframe.
The cryptocurrency has retreated from its September peak near $1.66, unable to sustain momentum from the previous upward movement.
According to CryptoQuant analytics, XRP holdings on Binance dropped to 2.69 billion tokens by Monday. This represents a decline from the 2.70 billion recorded the preceding Saturday.
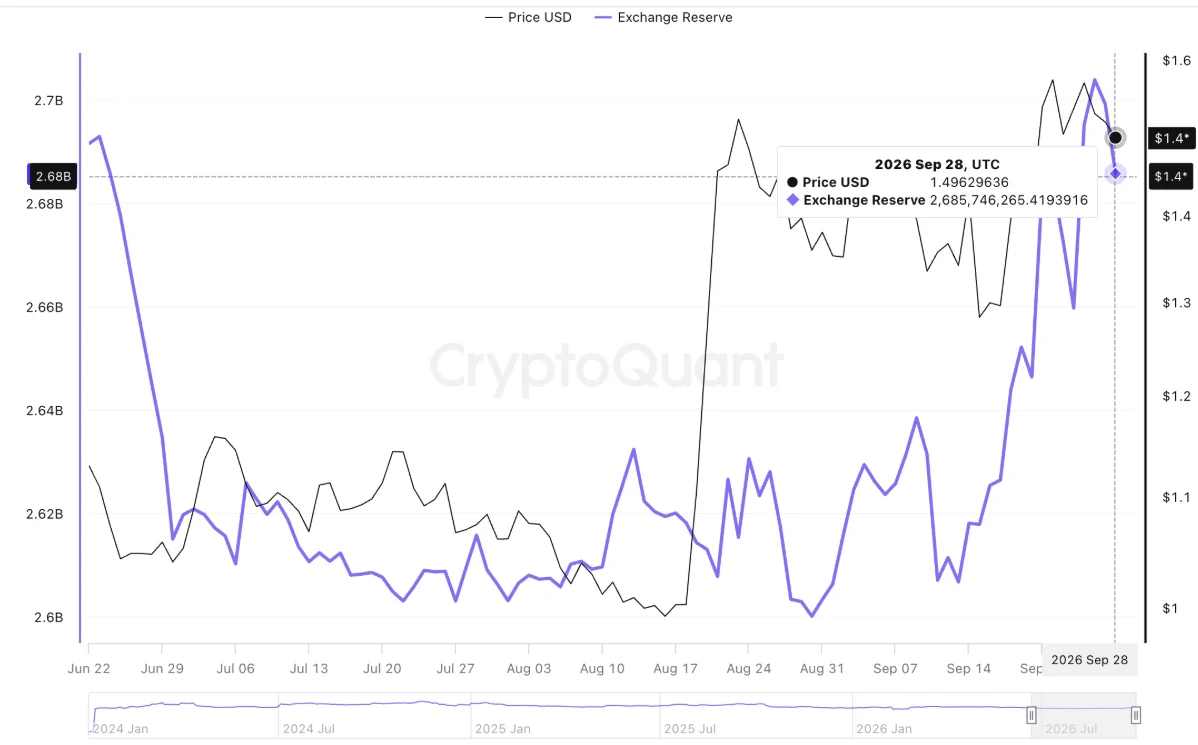
Declining exchange balances typically indicate reduced immediate selling pressure. When tokens transfer to self-custody wallets, it frequently signals that holders intend to maintain their positions for extended periods.

Critical Resistance Zones Under Watch
XRP currently faces a resistance band stretching from $1.53 to $1.60. Market analyst DukesMarketAnalysis identified the 0.382 Fibonacci retracement level at $1.532 as an additional obstacle.
This price zone has previously rejected upward momentum on multiple occasions. A sustained close above $1.60 would hold significantly more importance than a temporary spike through the level.
Cryptocurrency trader XRP Update, active on X as @XrpUdate, maintained that the bullish formation stays valid. The analyst observed that XRP reclaimed the Point of Control and emphasized that market attention has shifted to $1.58.
Technical charts also reveal a bullish flag pattern developing on the daily timeframe beneath resistance. This formation indicates support around $1.5070, with potential upside objectives at $1.7683 and $2.1667.
Market analyst Egrag Crypto characterized XRP as range-bound between $1.45 and $1.65. A decisive close above $1.65 would transform the technical structure to a more positive outlook, whereas a breakdown below $1.45 increases the probability of further decline toward $1.41 and $1.37.
Order book dynamics have transformed near the $1.52 level. Analyst CW8900 reported on X that XRP penetrated a sell wall at that price point and advanced to approximately $1.55, with new buy orders establishing support below.
Technical Indicators and Derivatives Activity
The 8-week and 21-week exponential moving averages have generated a bullish crossover on the weekly timeframe. This development suggests strengthening medium-term momentum, although it stops short of confirming a complete trend reversal.
The Relative Strength Index registers at 58.02 on TradingView, positioned above the neutral 50 threshold. The MACD line similarly trades above its signal line, reflecting a modest bullish orientation.
CoinGlass statistics reveal XRP futures volume decreased 4.31% to $5.46 billion. Meanwhile, open interest climbed 2.28% to $3.56 billion, indicating additional leveraged positions are being established.
Liquidation heatmap analysis identifies upside concentration zones at $1.53-$1.54 and $1.56-$1.58. Downside liquidation clusters are positioned at $1.49-$1.50 and $1.45-$1.46.
Weekly chart patterns continue displaying a sequence of lower highs and lower lows. Technical analysts emphasize that a breakout above previous peaks is necessary before this structure can be considered broken.
As of September 29, XRP oscillated between the upper $1.40s and mid $1.50s range. The token briefly touched above $1.60 during early September before reversing course, and currently remains below the $1.5070 and $1.246 thresholds that analysts are monitoring closely.
Get 3 Free Stock Ebooks
Discover top-performing stocks in AI, Crypto, and Technology with expert analysis.
- Top 10 AI Stocks - Leading AI companies
- Top 10 Crypto Stocks - Blockchain leaders
- Top 10 Tech Stocks - Tech giants


