

Key Takeaways
- XRP maintained critical support at $1.10 throughout June 11, finishing the session near $1.12 following increased trading activity
- Elliott Wave analysis identifies a three-wave impulse structure projecting a potential recovery toward $2.39-$3.11
- Technical analyst Ali Charts identified a TD Sequential buy signal appearing on XRP’s 3-day chart, suggesting near-term bullish momentum
- Investment vehicles tracking XRP experienced $1.19 million in net inflows, bringing total managed assets to approximately $948.98 million
- Immediate resistance barriers emerge at $1.12-$1.13, while the $1.2380 middle Bollinger Band represents the next significant hurdle
XRP successfully defended the psychologically important $1.10 threshold on June 11 throughout turbulent trading conditions, settling around $1.12 with approximately $1.94 billion in 24-hour trading volume. The digital asset posted a modest 0.72% daily gain while experiencing a 4.47% weekly decline and a more substantial 23.86% monthly drawdown. Market capitalization remained stable near $69.2 billion, securing XRP’s position as the sixth-largest cryptocurrency by valuation.
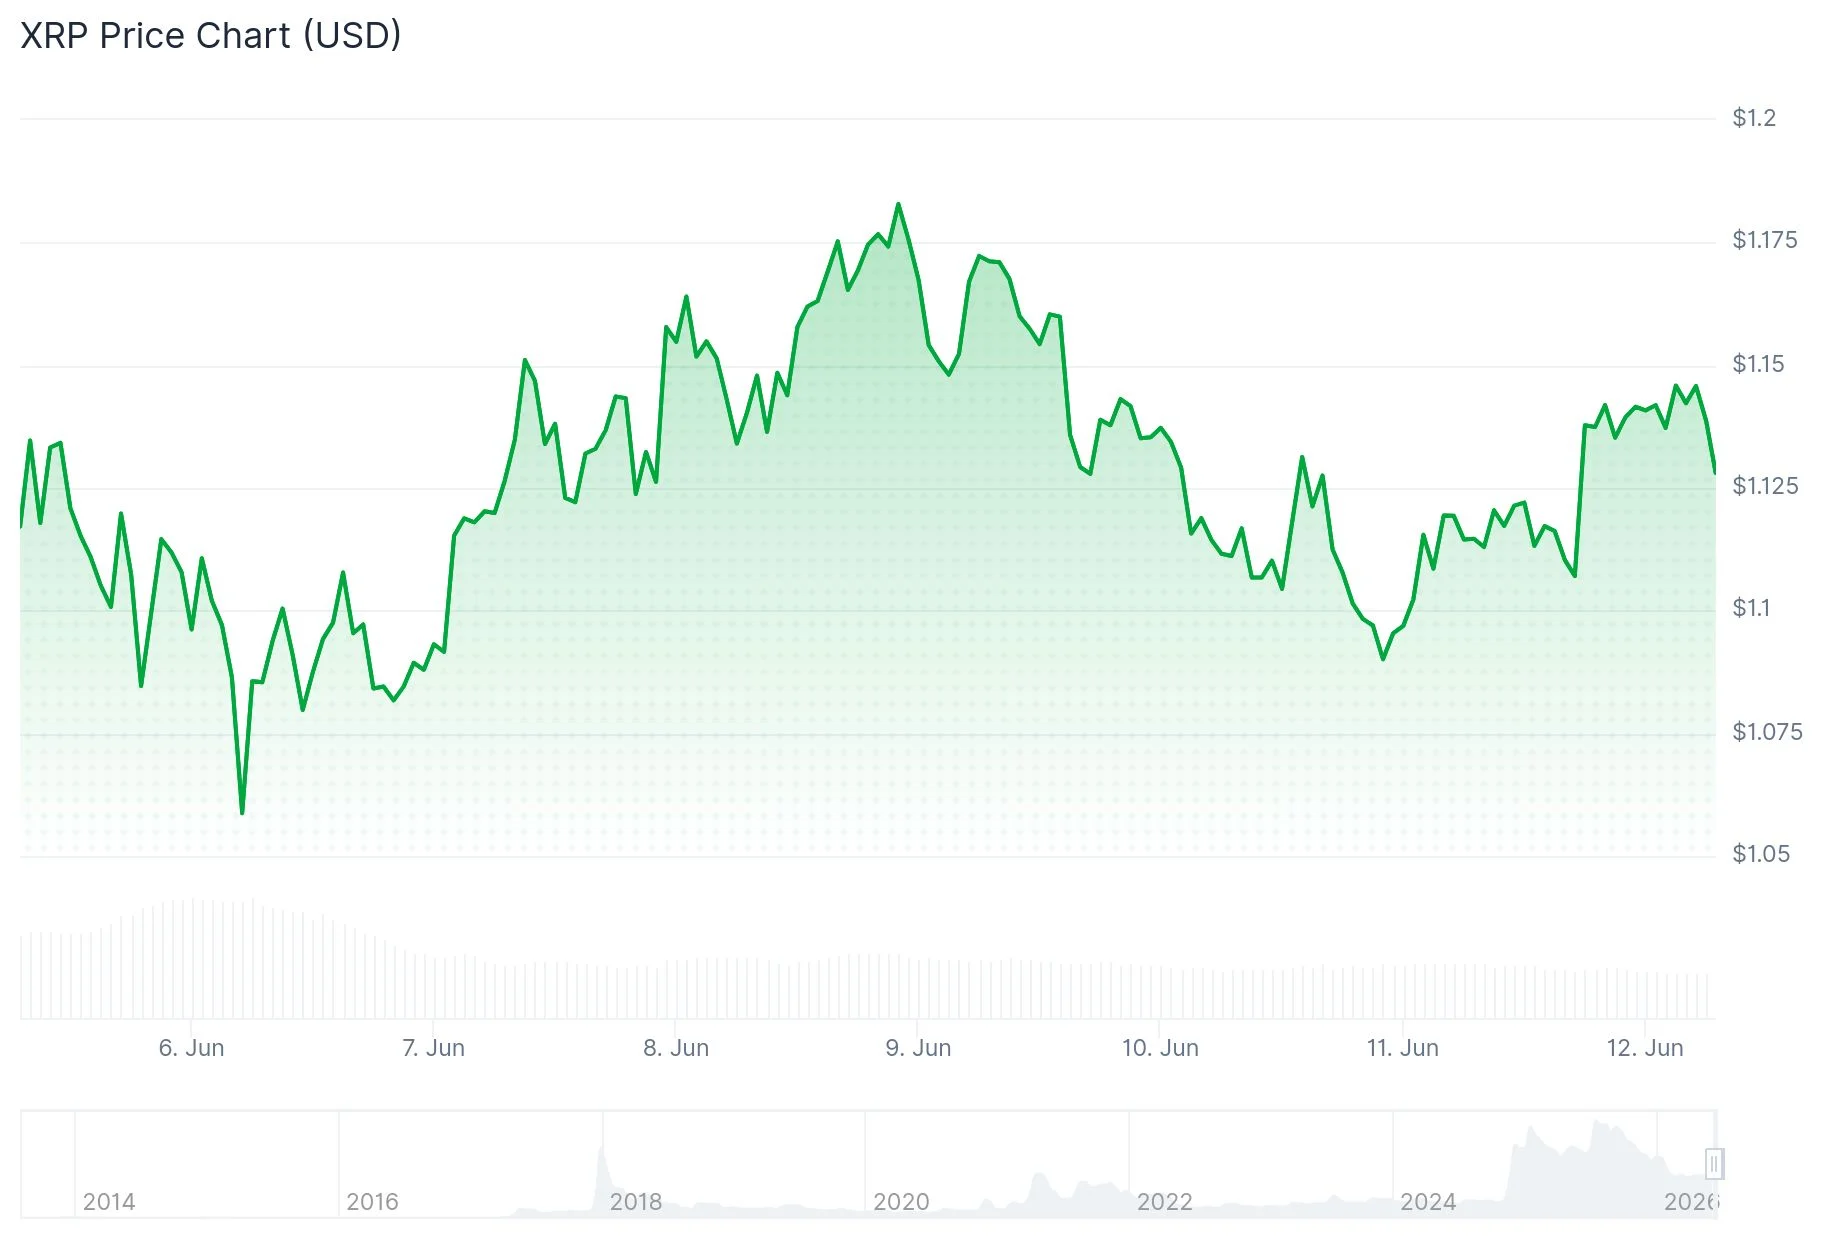
Market behavior indicates that accumulation occurred at the $1.10 boundary after the previous week’s dramatic selloff. This price level has emerged as a pivotal near-term floor, positioned just above the most recent swing low.
Cryptocurrency analyst Ali Charts highlighted on X that the TD Sequential momentum indicator has generated a buy signal on XRP’s 3-day timeframe. The analyst noted that historically, such higher-timeframe signals have frequently preceded rebounds lasting between one and four candlesticks, providing temporary respite following periods of market contraction.
XRP momentarily breached the $1.12 level during the final trading hours amid elevated volume activity. During earlier sessions, the token oscillated around $1.11 as buyers attempted to establish support.
The $1.12-$1.13 corridor represents the initial resistance barrier under trader scrutiny. A decisive close above $1.13 accompanied by expanding volume could pave the way toward $1.18, followed by $1.2380. Should XRP breach $1.10 to the downside, subsequent support zones emerge at $1.09 and the lower Bollinger Band positioned near $1.04.

Elliott Wave Structure Suggests $2.39-$3.11 Recovery Zone
A technical chart analysis circulated on X by analyst RWA_Investor outlines a potential three-wave corrective pattern originating from the recent trough near $1.07. The projection illustrates Wave A advancing toward $1.94, succeeded by a Wave B retracement to approximately $1.46, culminating in Wave C targeting a corridor between $2.39 and $3.11.
The anticipated Wave B pullback to $1.46 should not be interpreted as bearish deterioration, according to the technical framework. Instead, it represents a typical consolidation phase preceding the most powerful impulse wave.
A sustained breakout above $3.10 would indicate that XRP’s long-term bottom has been established in the $1.05 vicinity. However, if the advance falters beneath the upper projection band, market observers have identified a potential alternative scenario involving a retest of the $0.75-$1.00 range.
Investment Product Inflows Increase Amid Subdued Momentum
XRP-focused investment vehicles registered $1.19 million in daily net inflows based on SoSoValue metrics, with cumulative net assets approaching $948.98 million. While the inflows represent a moderately constructive development, total assets remain beneath previous peak levels.
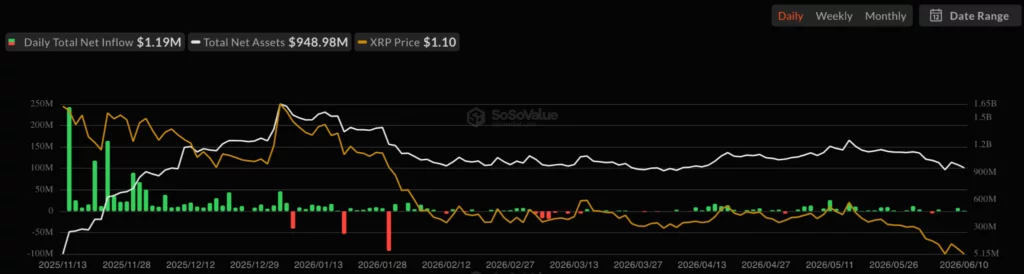
Derivatives open interest persisted near cycle nadirs, indicating that market participants have not yet established substantial directional commitments. Although volume has experienced upticks, the market structure suggests predominance of short-term tactical positioning rather than sustained trend-following behavior.
The daily chart configuration remains within a downward trajectory from January peaks exceeding $2.30. XRP underwent consolidation between March and May before experiencing a June breakdown. Bulls must recapture the middle Bollinger Band at $1.2380 to signal that a more sustainable recovery phase is materializing.
Get 3 Free Stock Ebooks
Discover top-performing stocks in AI, Crypto, and Technology with expert analysis.
- Top 10 AI Stocks - Leading AI companies
- Top 10 Crypto Stocks - Blockchain leaders
- Top 10 Tech Stocks - Tech giants

