


Key Takeaways
- Ripple’s XRP tested a critical support zone at $1.2710 on May 28, marking its lowest level since February 2025.
- Technical indicators show a potential triple-bottom formation alongside a hammer candlestick pattern, both considered bullish reversal signals.
- Spot XRP ETFs recorded $118 million in net inflows this month, significantly outperforming Bitcoin and Ethereum fund flows.
- Technical analyst ChartNerd cautioned that losing the $1.28–$1.24 support range could trigger a decline toward $1.00.
- Ripple’s RLUSD stablecoin has expanded to an $1.8 billion market cap, with monthly trading volume increasing 61%.
Ripple’s native token experienced significant downward pressure this week, reaching a pivotal support threshold that has proven resilient throughout 2025. XRP bottomed at $1.2710 on May 28, a price level that previously provided strong support in February and twice during April.
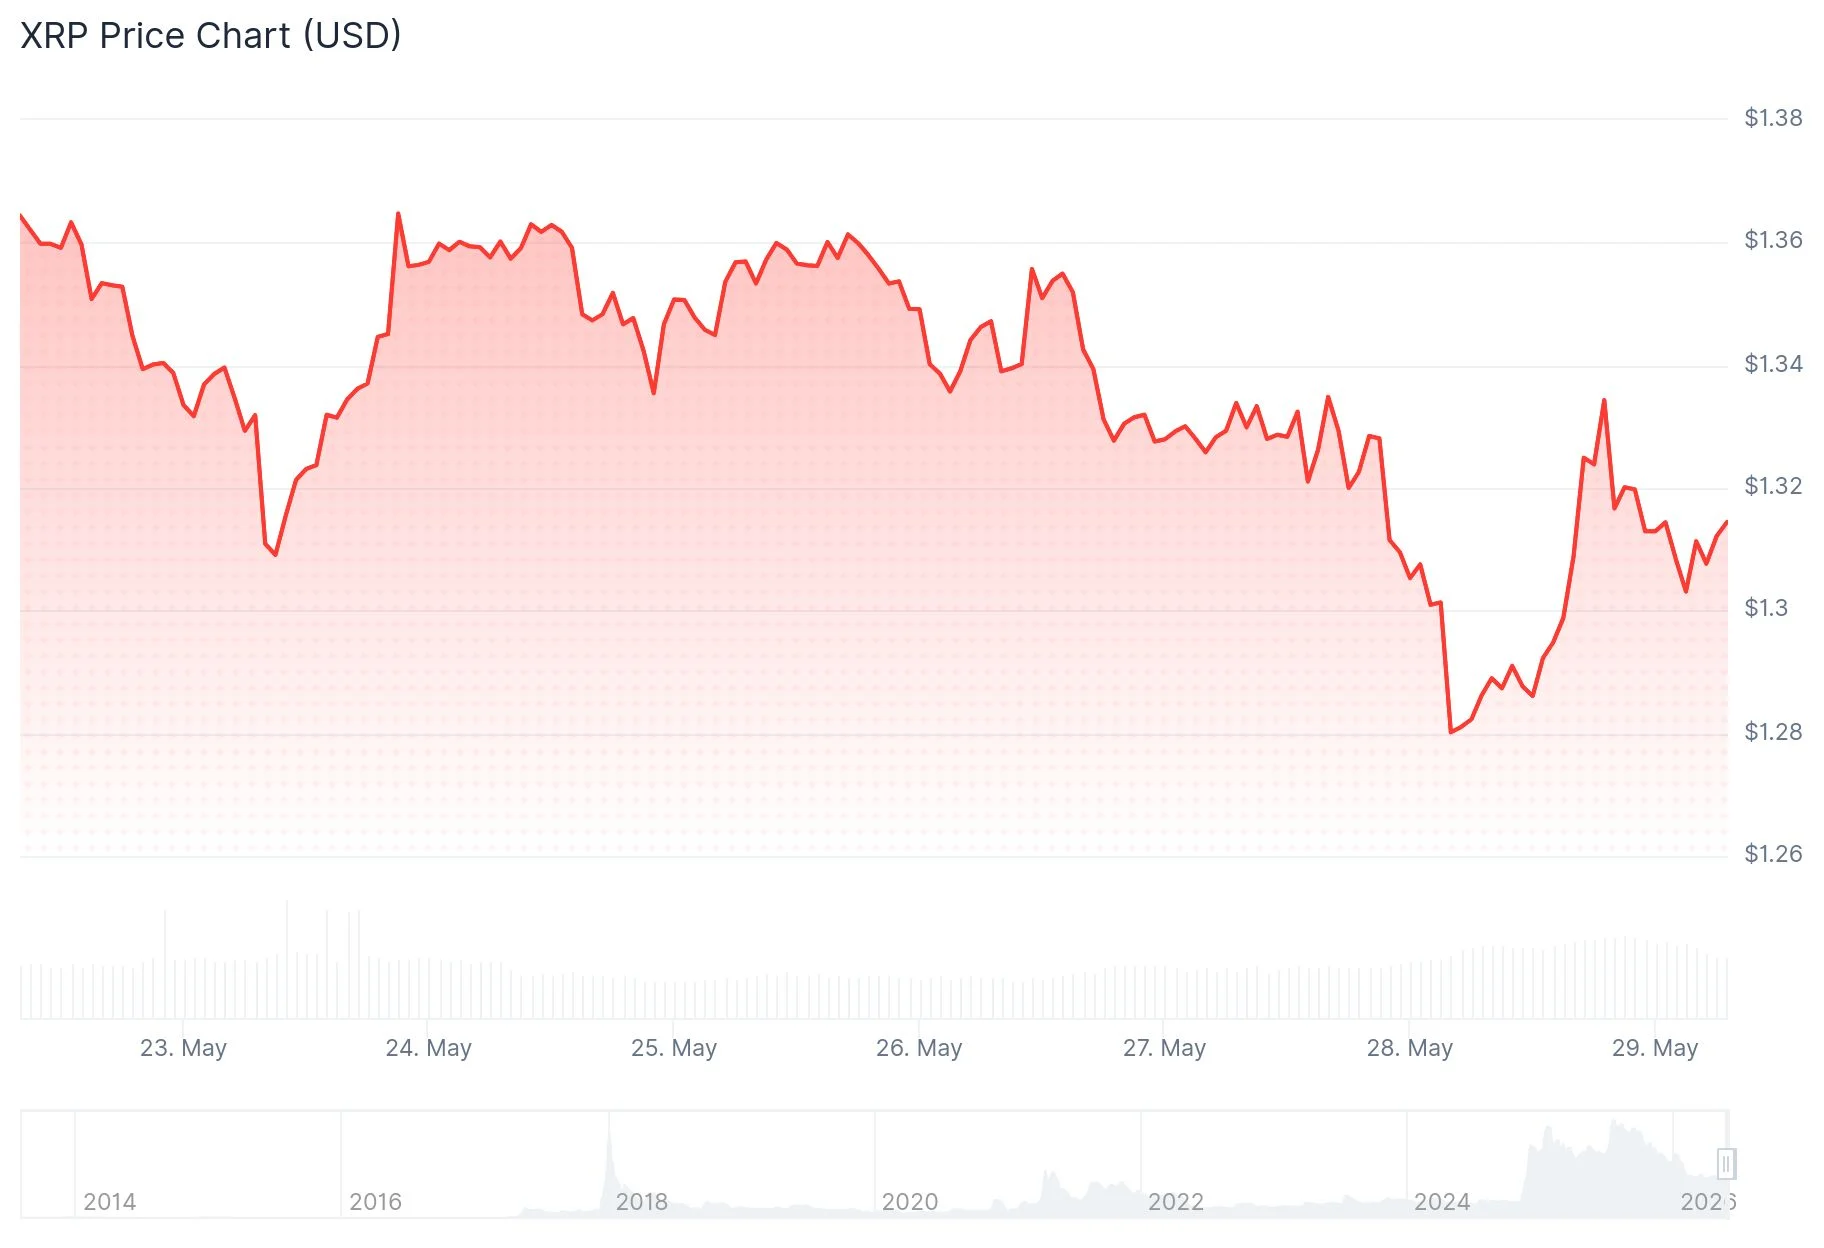
The digital asset has corrected approximately 18% from its May 14 peak of $1.5480 over a two-week period. This downward movement coincided with widespread selling pressure across cryptocurrency markets, affecting Bitcoin and numerous alternative cryptocurrencies.
Recovery efforts have begun showing signs of life. On May 29, XRP rebounded above $1.29 before encountering resistance around the $1.32 level. The asset is presently trading beneath its 100-hourly simple moving average.
Technical Analysis Signals
Market participants are closely monitoring the $1.2710 support threshold. Three distinct rebounds from this price point throughout the year have created what appears to be a triple-bottom formation, a technical pattern that analysts frequently interpret as diminishing bearish momentum.
Additionally, the daily chart is displaying a hammer candlestick formation, characterized by a compact body and an extended lower wick. This particular pattern commonly precedes short-term upward price movements.

Should XRP successfully defend the $1.2710 level, market observers anticipate a potential rally toward $1.50, representing approximately 15% upside from present values. Critical resistance barriers stand at $1.3280, followed by $1.3420, and subsequently $1.3650.
Technical analyst ChartNerd shared his perspective on X: “$XRP has swept below the $1.30 guardrail and is now searching for the lowest daily candle close since early February. Current FIB support rests between $1.28/$1.24. It’s got to hold, or the $1 potential opens up sooner rather than later.” This assessment emphasizes the significance of maintaining the current support zone.
A breakdown below $1.2720 would expose downside objectives at $1.2550 and subsequently $1.2250. Further weakness could test the 2025 low of $1.1176.
Strong ETF Performance and RLUSD Growth
Despite recent price weakness, fundamental metrics paint a more optimistic picture. Spot XRP exchange-traded funds have attracted $118 million in net inflows throughout May, representing the strongest monthly performance in 2025 and the third-highest since product launches.
Bitwise’s XRP ETF has independently accumulated more than $446 million in cumulative inflows and currently manages $337 million in assets under management. Additional data revealed that institutional investors purchased $1.77 million in XRP during a single trading session, pushing combined ETF-held assets to $1.12 billion.
In stark contrast, spot Bitcoin ETF products experienced more than $2 billion in net outflows this month, while Ethereum-focused funds recorded $401 million in redemptions.
Ripple’s proprietary stablecoin, RLUSD, has demonstrated continued expansion. The token now commands an $1.8 billion market capitalization, substantially higher than its initial $697 million valuation. Adjusted monthly trading volume reached $11.1 billion, reflecting a 61% month-over-month increase.
XRP concluded May 29 trading sessions near $1.30, with market participants on both sides closely watching the critical $1.2710 support boundary.
Get 3 Free Stock Ebooks
Discover top-performing stocks in AI, Crypto, and Technology with expert analysis.
- Top 10 AI Stocks - Leading AI companies
- Top 10 Crypto Stocks - Blockchain leaders
- Top 10 Tech Stocks - Tech giants


