

Key Takeaways
- XRP currently trades at $1.12, gaining 1.82% over the past 24 hours with a market capitalization of $69.45 billion
- The digital asset successfully breached a descending trend line at the $1.10 mark and surpassed the 23.6% Fibonacci retracement threshold
- Primary resistance zones are positioned at $1.1720 and $1.2080 — clearing $1.2080 may trigger movement toward $1.2450
- Should bullish momentum stall near $1.1740, downside targets include $1.1250, $1.110, and $1.050
- Market analyst Ali Charts identifies $0.90 as a potentially robust accumulation zone for long-term positioning
XRP has regained its footing above the psychologically important $1 threshold following recent downward pressure, currently changing hands at $1.12. The cryptocurrency has recorded a 1.82% increase over the last 24 hours, accompanied by $2.93 billion in trading activity and maintaining a $69.45 billion market capitalization.
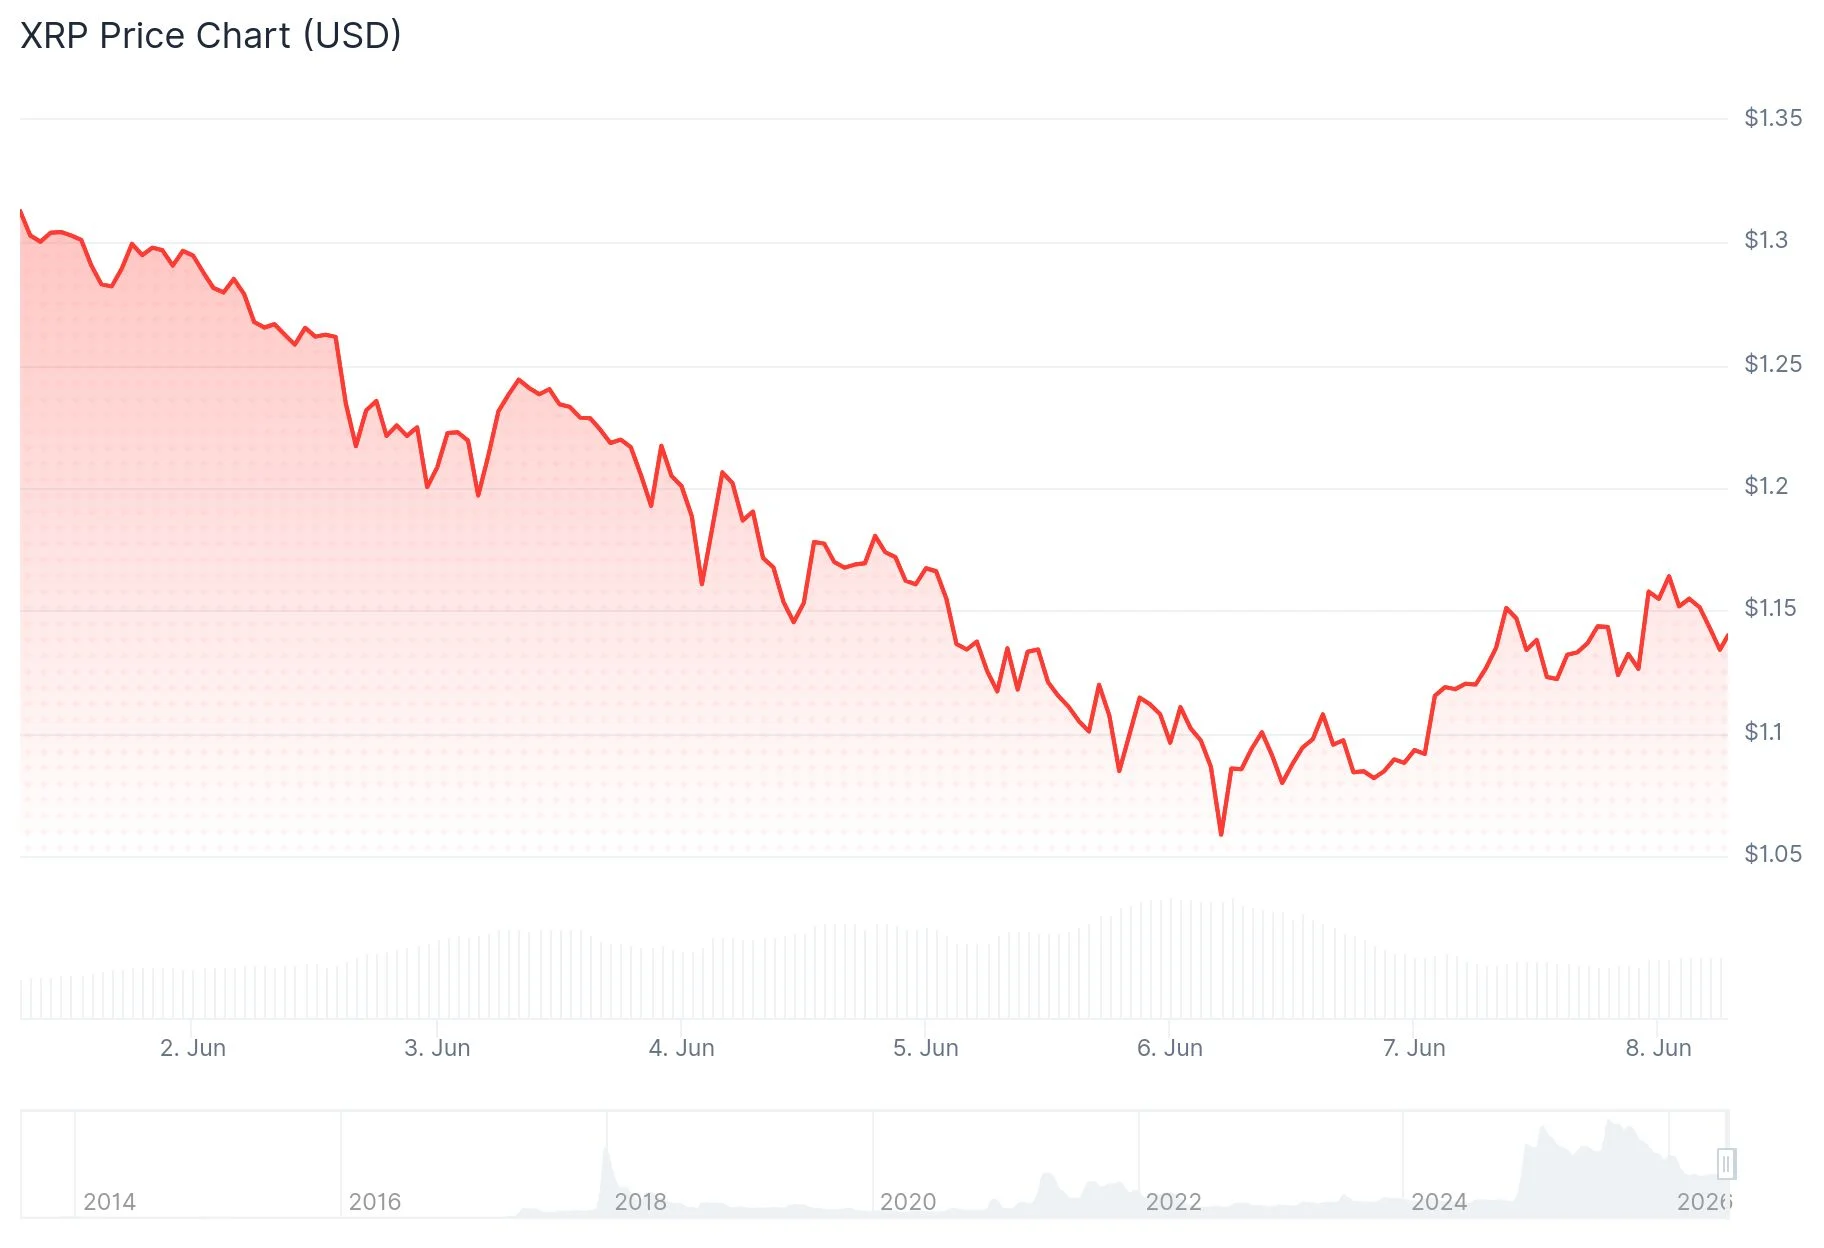
The upward movement initiated after XRP defended the crucial support zone above $1.050. Buyers subsequently drove the asset beyond the $1.10 and $1.120 thresholds, successfully penetrating a descending trend line that had functioned as resistance on the 60-minute timeframe.
The cryptocurrency also moved above the 23.6% Fibonacci retracement point measured from the swing high at $1.3640 down to the $1.052 bottom. Currently, XRP maintains its position above the 100-period Simple Moving Average on the hourly chart.
Market analyst Ali Charts shared on X that the $0.90 price level represents a critical zone worth monitoring, suggesting that should XRP retreat to this area, it may present an attractive entry point for those with a longer investment horizon.
Critical Resistance Zones Ahead
The immediate obstacle lies at $1.1720. Successfully breaking through this barrier would pave the way toward $1.2080, which corresponds with the 50% Fibonacci retracement marker. Beyond that threshold, subsequent price objectives include $1.2150, $1.220, and $1.2450.

Potential Downside Scenarios
If XRP encounters rejection around $1.1740 without achieving a decisive breakout, a retracement becomes probable. The first line of defense appears at $1.1250, with additional support at $1.110. Losing the $1.110 level could trigger further declines toward $1.080 and eventually the $1.050 region.
The Relative Strength Index currently registers 25.40, indicating oversold conditions, although the recent bounce suggests diminishing selling pressure. The MACD indicator hovers below its signal line at -0.0700 compared to -0.0476, signaling that short-term bearish momentum persists.
On June 7, analyst Crypto Patel observed that XRP is presently trading approximately 37,000% above its 2017 bottom. He disclosed his accumulation range between $1.00 and $0.60, arguing that if XRP eventually reaches $10–$20 during future market cycles, today’s price levels may appear as exceptional entry opportunities when viewed retrospectively.
The MACD histogram value of -0.0224 indicates ongoing bearish control, suggesting bulls require a positive MACD crossover to establish convincing upward momentum.
Get 3 Free Stock Ebooks
Discover top-performing stocks in AI, Crypto, and Technology with expert analysis.
- Top 10 AI Stocks - Leading AI companies
- Top 10 Crypto Stocks - Blockchain leaders
- Top 10 Tech Stocks - Tech giants

