

Key Takeaways
- XRP has plummeted 68.5% since reaching $3.65 in July 2025, currently hovering around $1.14
- Critical support at $1.27 has been breached and now serves as a resistance barrier
- Crypto analyst Ali Martinez highlights $0.90 as a strategic accumulation zone
- Blockchain metrics present conflicting narratives: whale holdings increase while tokenized asset activity declines 59%
- Momentum indicators such as RSI under 31 and bearish weekly patterns indicate further downside risk
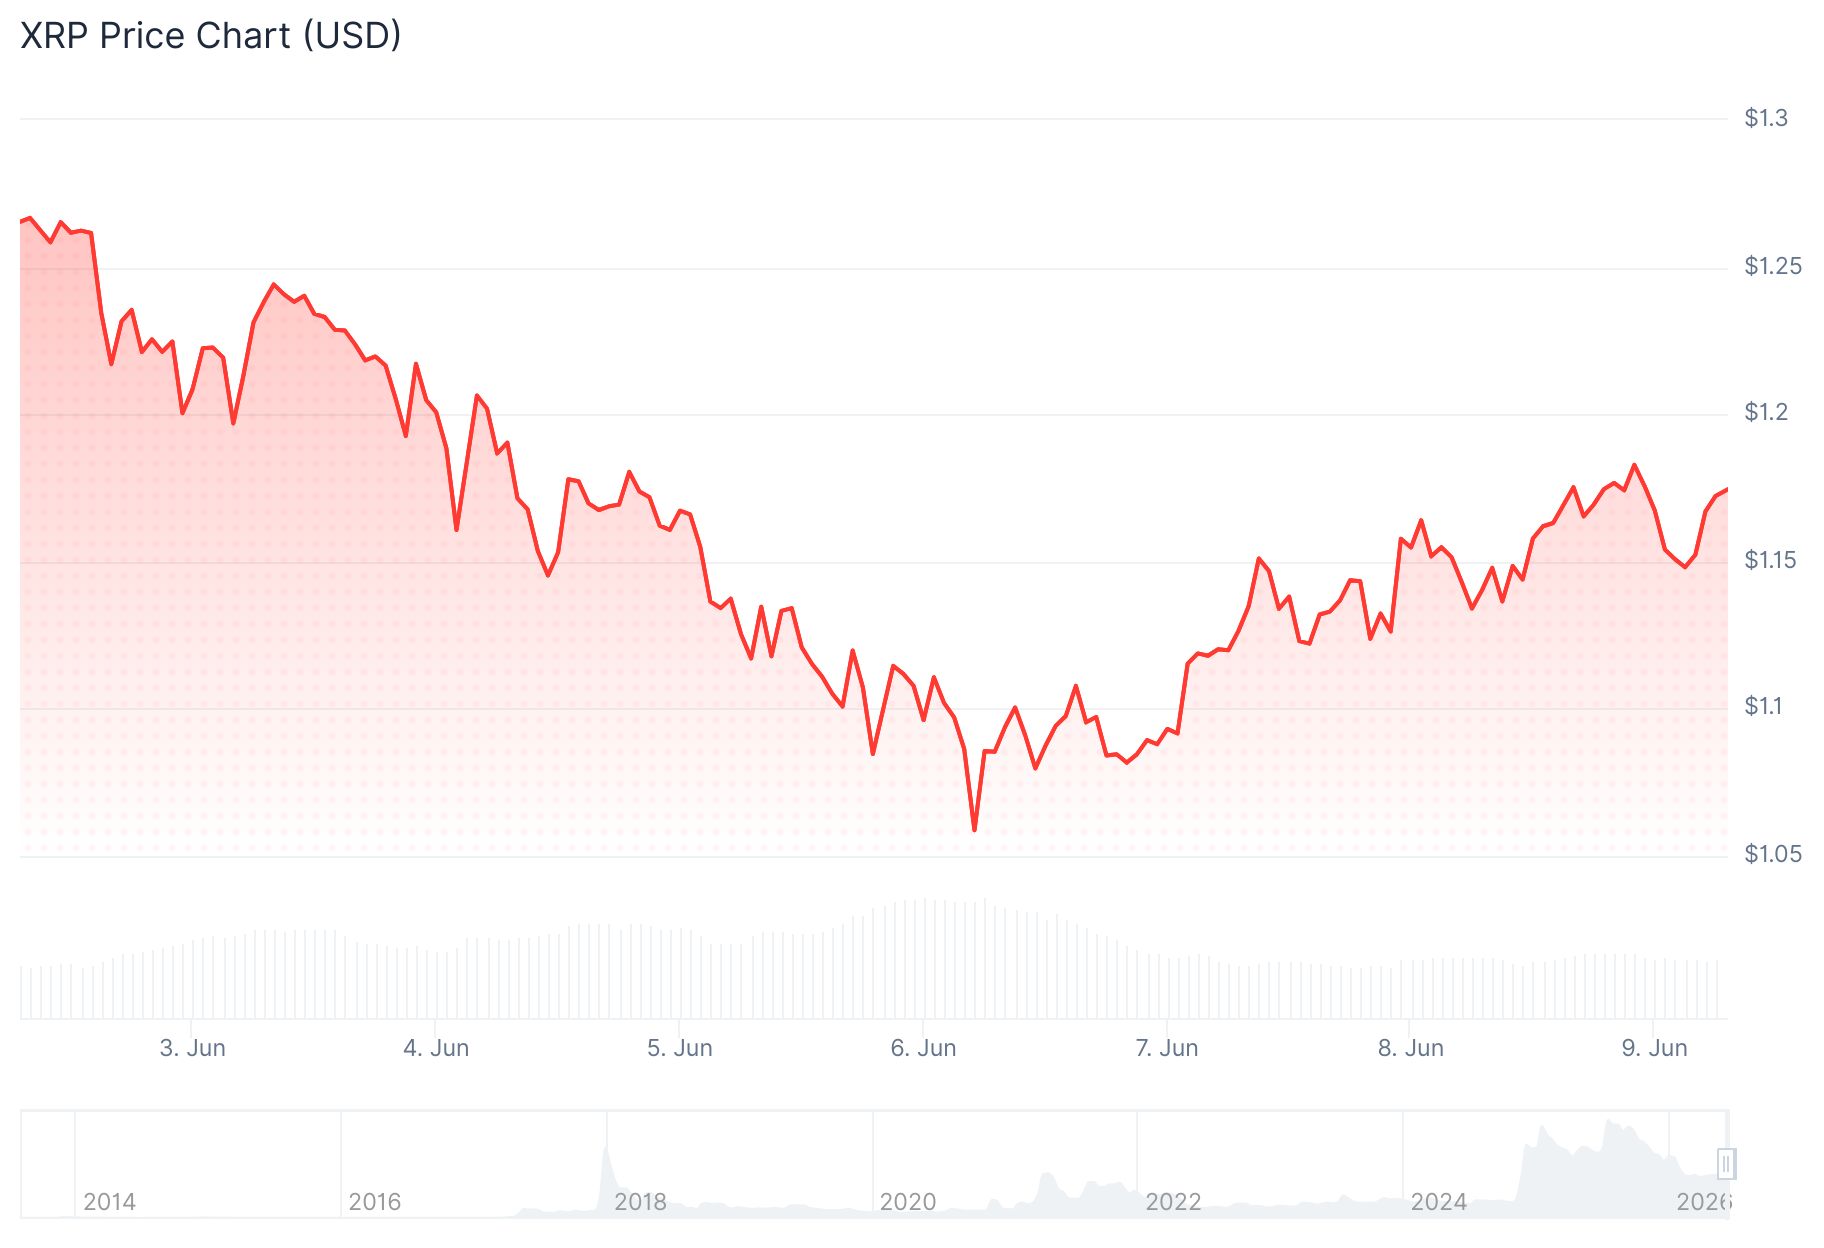
XRP has tumbled to approximately $1.14, marking its weakest performance in close to 19 months. The digital asset has surrendered 68.5% of its value since touching an all-time high of $3.65 during July 2025.
The selloff has intensified in recent trading sessions. XRP shed 11.8% over the previous week while experiencing a near 18.9% decline across the last month.
Market participants are now fixating on the $1 threshold as the next critical psychological support boundary should current price floors fail to hold.
Historical patterns show XRP is no stranger to severe corrections. The token has endured four separate drawdowns exceeding 40% within six-month periods over the past five years. The present 46% six-month correction aligns with this established trend.
ChartNerd, an analyst who accurately predicted the prior three cycle bottoms using Gaussian Channel analysis, observes that XRP bear cycles have historically extended between 400 and 790 days with retracements ranging from 85% to 96%. He points out the current downturn has persisted roughly 350 days with a 71% decline from the July 2025 summit. His projections place the cycle bottom within the $0.70 to $0.90 corridor, potentially materializing before the end of the year.

https://twitter.com/ChartNerd TA/status/2063926850909266424?s=20
Technical Indicators Signal Continued Weakness
XRP has penetrated the $1.27 threshold, transforming what was formerly a support floor into an overhead resistance barrier. A temporary bounce to $1.14 occurred alongside a 44% contraction in trading volume, which market analysts frequently interpret as insufficient buying momentum.
The 14-day Relative Strength Index has dropped beneath 31, placing XRP firmly in oversold conditions. The weekly MACD continues trading below the zero line. The Aroon Down metric registers 85.71% compared to an Aroon Up reading of merely 35.71%, demonstrating persistent selling pressure.
The 200-day moving average rests at $1.6179, representing a substantial resistance level above current prices. Should XRP close below $1.10 on a daily basis, the token could test $1.09, and a breakdown from that level would likely trigger sub-dollar price action.
Prominent cryptocurrency analyst Ali Martinez has identified $0.90 as his primary monitoring level. In a June 7 statement, he remarked: “If price gets there, I think it could offer a compelling long-term buying opportunity.” Martinez’s observation reflects increasing analyst focus on the $0.90 to $1.00 range as a potential accumulation zone for strategic investors.
Blockchain Metrics Show Conflicting Trends
Despite the bearish price action, certain indicators suggest bullish undertones. Exchange withdrawals recently totaled over 25 million XRP, a movement typically associated with long-term holding strategies. Binance deposits reached their 2026 low point this week. Whale wallet addresses have climbed to an unprecedented 332,230.
Conversely, fundamental activity metrics for the XRP Ledger reveal concerning trends. Tokenized asset transfer volume on XRPL contracted 59% over the past month to $54.1 million. The total value of tokenized assets on XRPL decreased 11% to $384.5 million. XRPL currently commands slightly more than 1% of the overall tokenized asset sector.
Meanwhile, stablecoin transaction volume on XRPL surged 118% to $4.5 billion, while the count of real-world asset holders on the network exploded 275% to 105 participants.
The upcoming major macroeconomic catalyst arrives with US CPI data scheduled for release on June 10, 2026.
Get 3 Free Stock Ebooks
Discover top-performing stocks in AI, Crypto, and Technology with expert analysis.
- Top 10 AI Stocks - Leading AI companies
- Top 10 Crypto Stocks - Blockchain leaders
- Top 10 Tech Stocks - Tech giants

