

Key Takeaways
- XRP has fallen to its lowest point in 15 weeks, touching $1.2677 after declining more than 66% from recent highs
- Current trading remains beneath the $1.280 mark and the 100-hourly Simple Moving Average
- Primary resistance zone located at $1.3150; surpassing $1.340 may trigger movement toward $1.3550
- Technical analyst ChartNerdTA noted two unsuccessful recovery attempts following a November 2025 deathcross signal
- Strategic accumulation range identified from $1.10 to $1.30, with additional support predicted between $0.65 and $0.85
XRP has entered a distinctly bearish phase following its inability to maintain prices above the $1.320 threshold, plummeting to a 15-week nadir around $1.2677. This downward movement mirrors broader cryptocurrency market weakness, with major assets like Bitcoin and Ethereum experiencing comparable selling pressure.
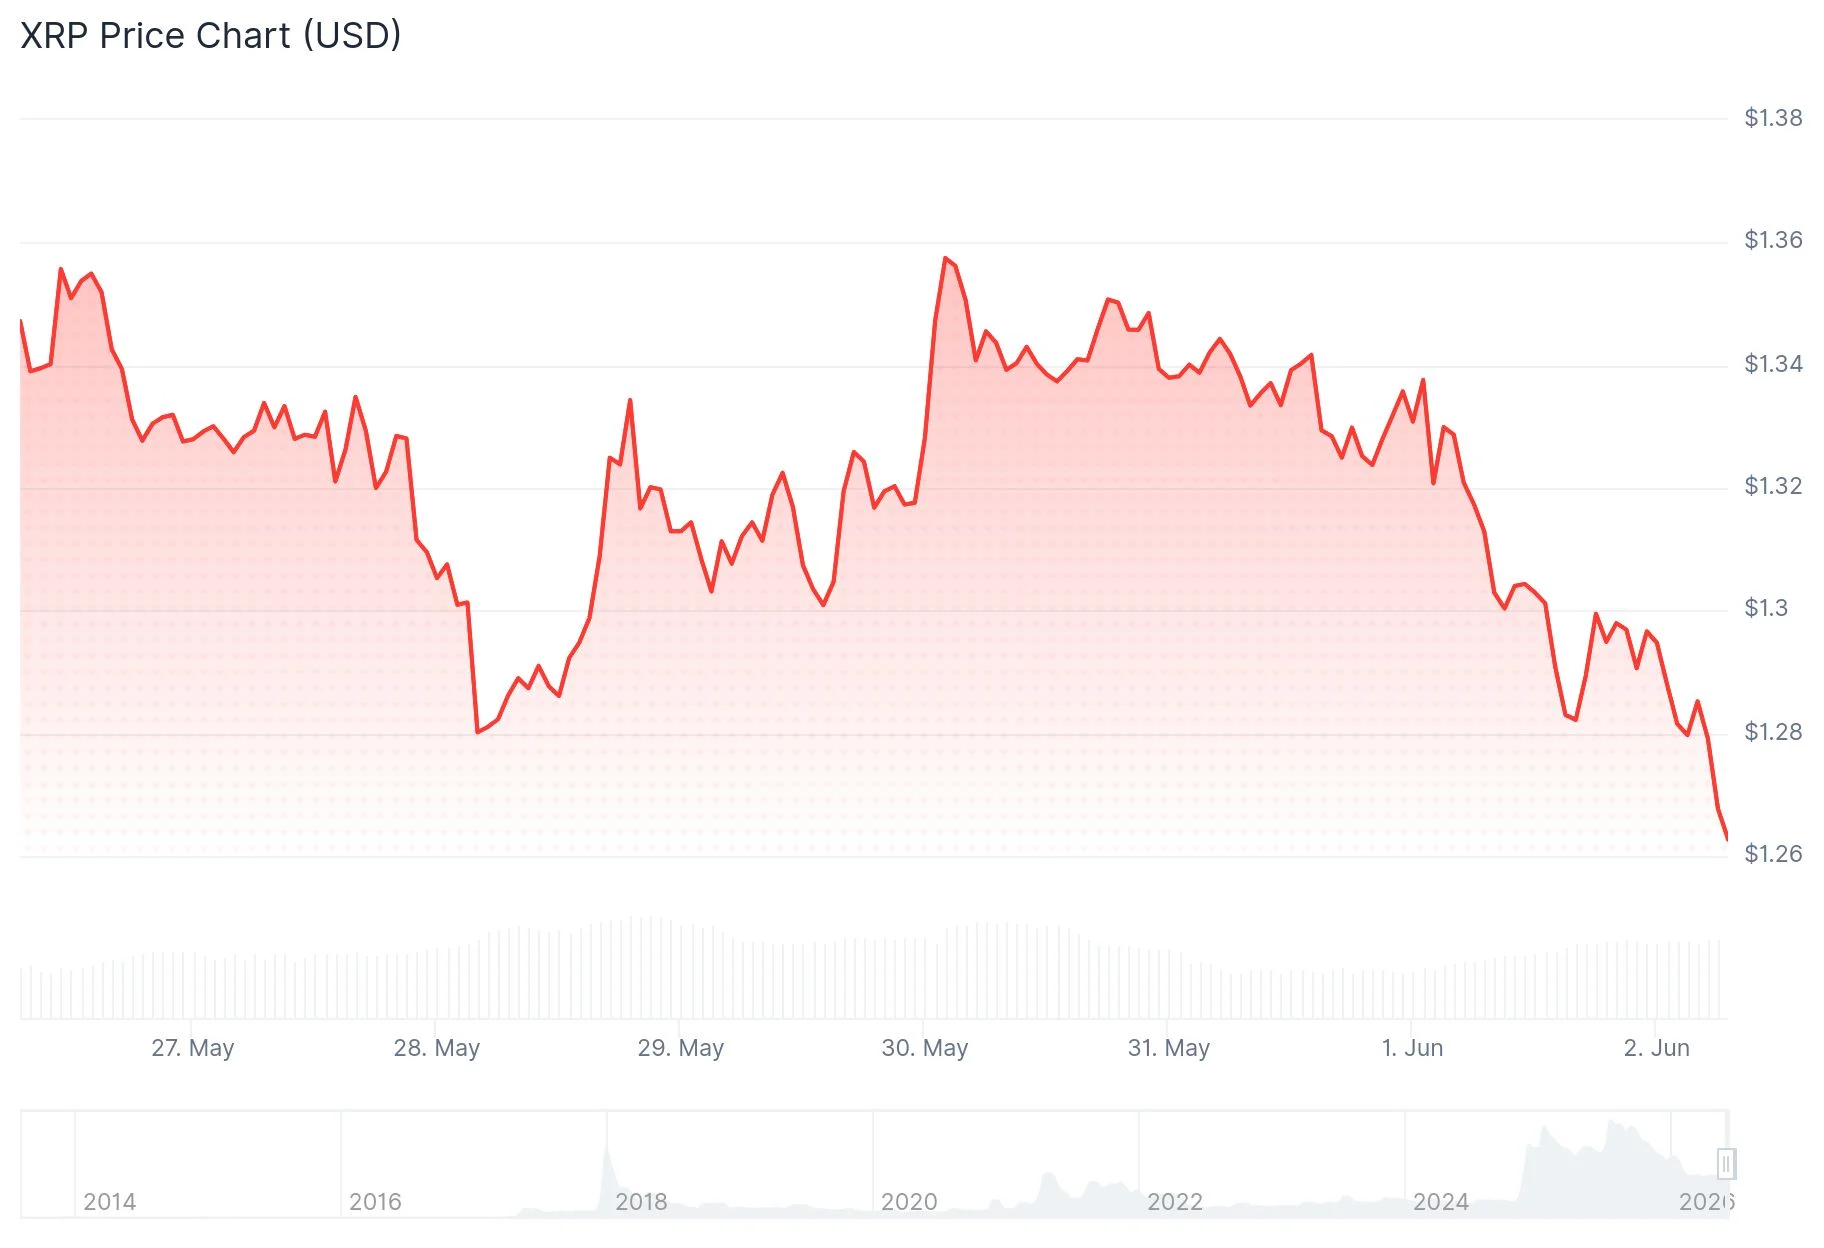
The digital asset has extended its decline beneath the $1.2880 level and continues trading underneath the 100-hourly Simple Moving Average. After reaching a session low of $1.2752, the token has settled into a consolidation pattern within that vicinity.
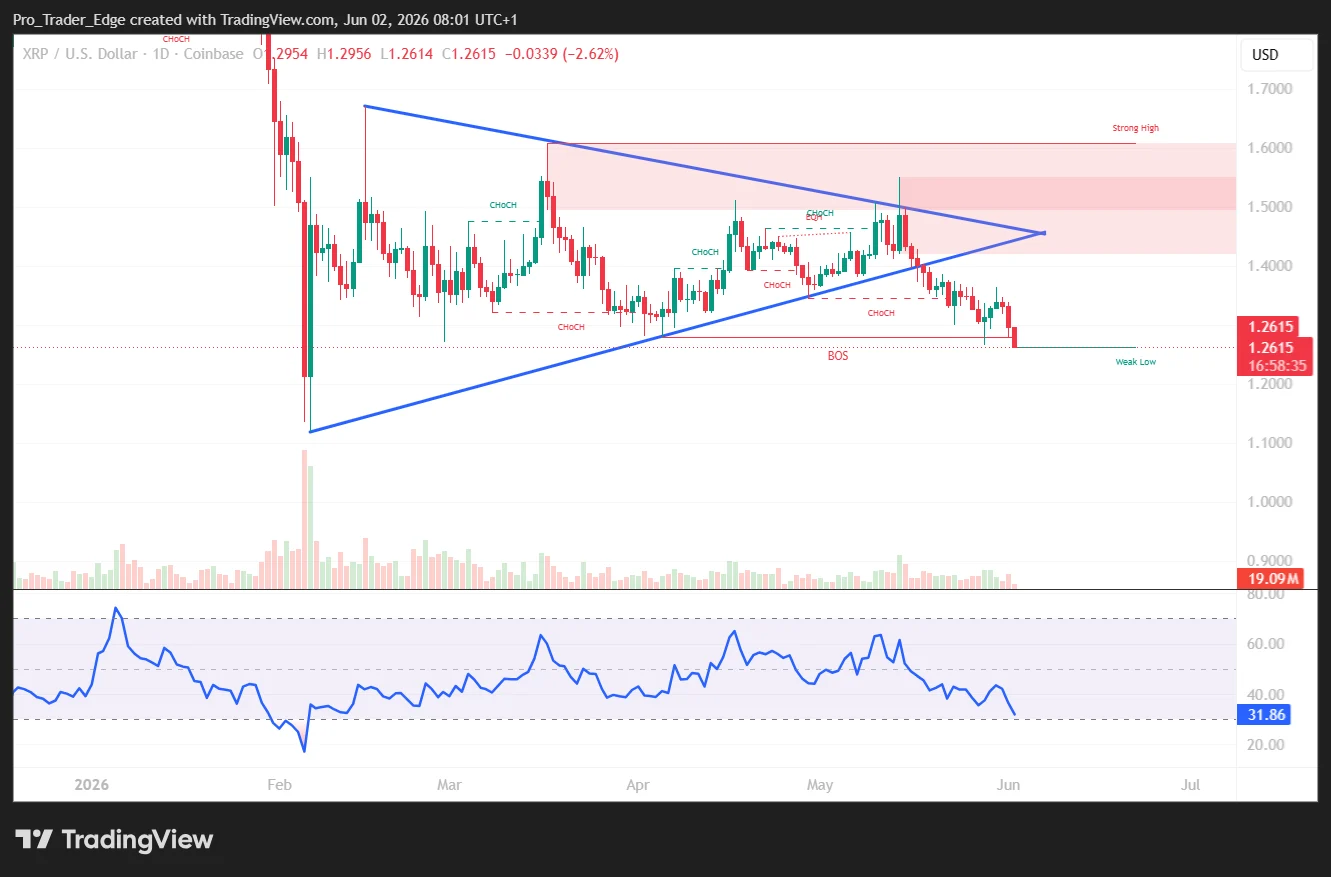
Technically, XRP is positioned below the 23.6% Fibonacci retracement calculated from the upward move between the $1.2752 floor and the $1.3642 peak. This configuration signals a vulnerable technical setup for the cryptocurrency.
Regarding upward movement, initial resistance appears near $1.2920, with secondary resistance at $1.2960. The critical resistance barrier sits at $1.3150, coinciding with the 50% Fibonacci retracement level derived from the descent between $1.3638 and $1.2677.
Should XRP manage a decisive break above $1.320, potential targets include $1.3275 and subsequently $1.340. Additionally, a descending trendline has emerged on the hourly timeframe, presenting resistance near the $1.340 zone.

Sustained Bearish Control Since Late 2025
Technical analyst ChartNerdTA highlighted on X that $XRP has experienced two unsuccessful rally attempts since a 5-day 20/50 EMA deathcross materialized in November 2025. The initial recovery peaked around $2.40 at the 50 EMA during January before collapsing to $1.11. The subsequent rally met rejection at the 20 EMA near $1.54 in May—both instances confirming a pattern of diminishing peaks and persistent downside momentum.
The comprehensive decline from XRP’s recent apex now exceeds 66%, prompting market participants to reevaluate potential support foundations.
One market analyst has designated the $1.10–$1.30 corridor as a viable accumulation territory for investors seeking to establish positions incrementally. The recommended approach involves dollar-cost averaging rather than deploying capital in a single transaction.
Lower Support Zones Under Consideration
Should the $1.10–$1.30 bracket prove insufficient, analysts have identified the next meaningful support region between $0.65 and $0.85. These levels represent more robust demand zones derived from historical price behavior.
Extended price objectives of $5, $10, and $15 have surfaced in technical frameworks, referencing a prior accumulation phase that preceded an 835% surge.
On the downside, if XRP breaches $1.2550, subsequent support levels emerge at $1.2320 followed by $1.220. A decline below the $1.20 psychological level would potentially unlock additional downside exposure.
Current market data indicates XRP is consolidating marginally below $1.280, with bearish forces maintaining dominance over near-term price action.
Get 3 Free Stock Ebooks
Discover top-performing stocks in AI, Crypto, and Technology with expert analysis.
- Top 10 AI Stocks - Leading AI companies
- Top 10 Crypto Stocks - Blockchain leaders
- Top 10 Tech Stocks - Tech giants

