


Quick Overview
- XRP currently sits at $1.36 with a 3.49% increase over the last 24 hours and market capitalization around $84.18 billion
- Technical analyst EGRAG CRYPTO emphasizes that structural patterns carry more weight than short-term price fluctuations
- Price action remains confined within a descending broadening wedge, historically associated with explosive moves
- Critical support zone identified at $1.11; a breach could accelerate downside momentum
- Resistance target at $3.00 represents the threshold bulls must overcome to validate bullish continuation
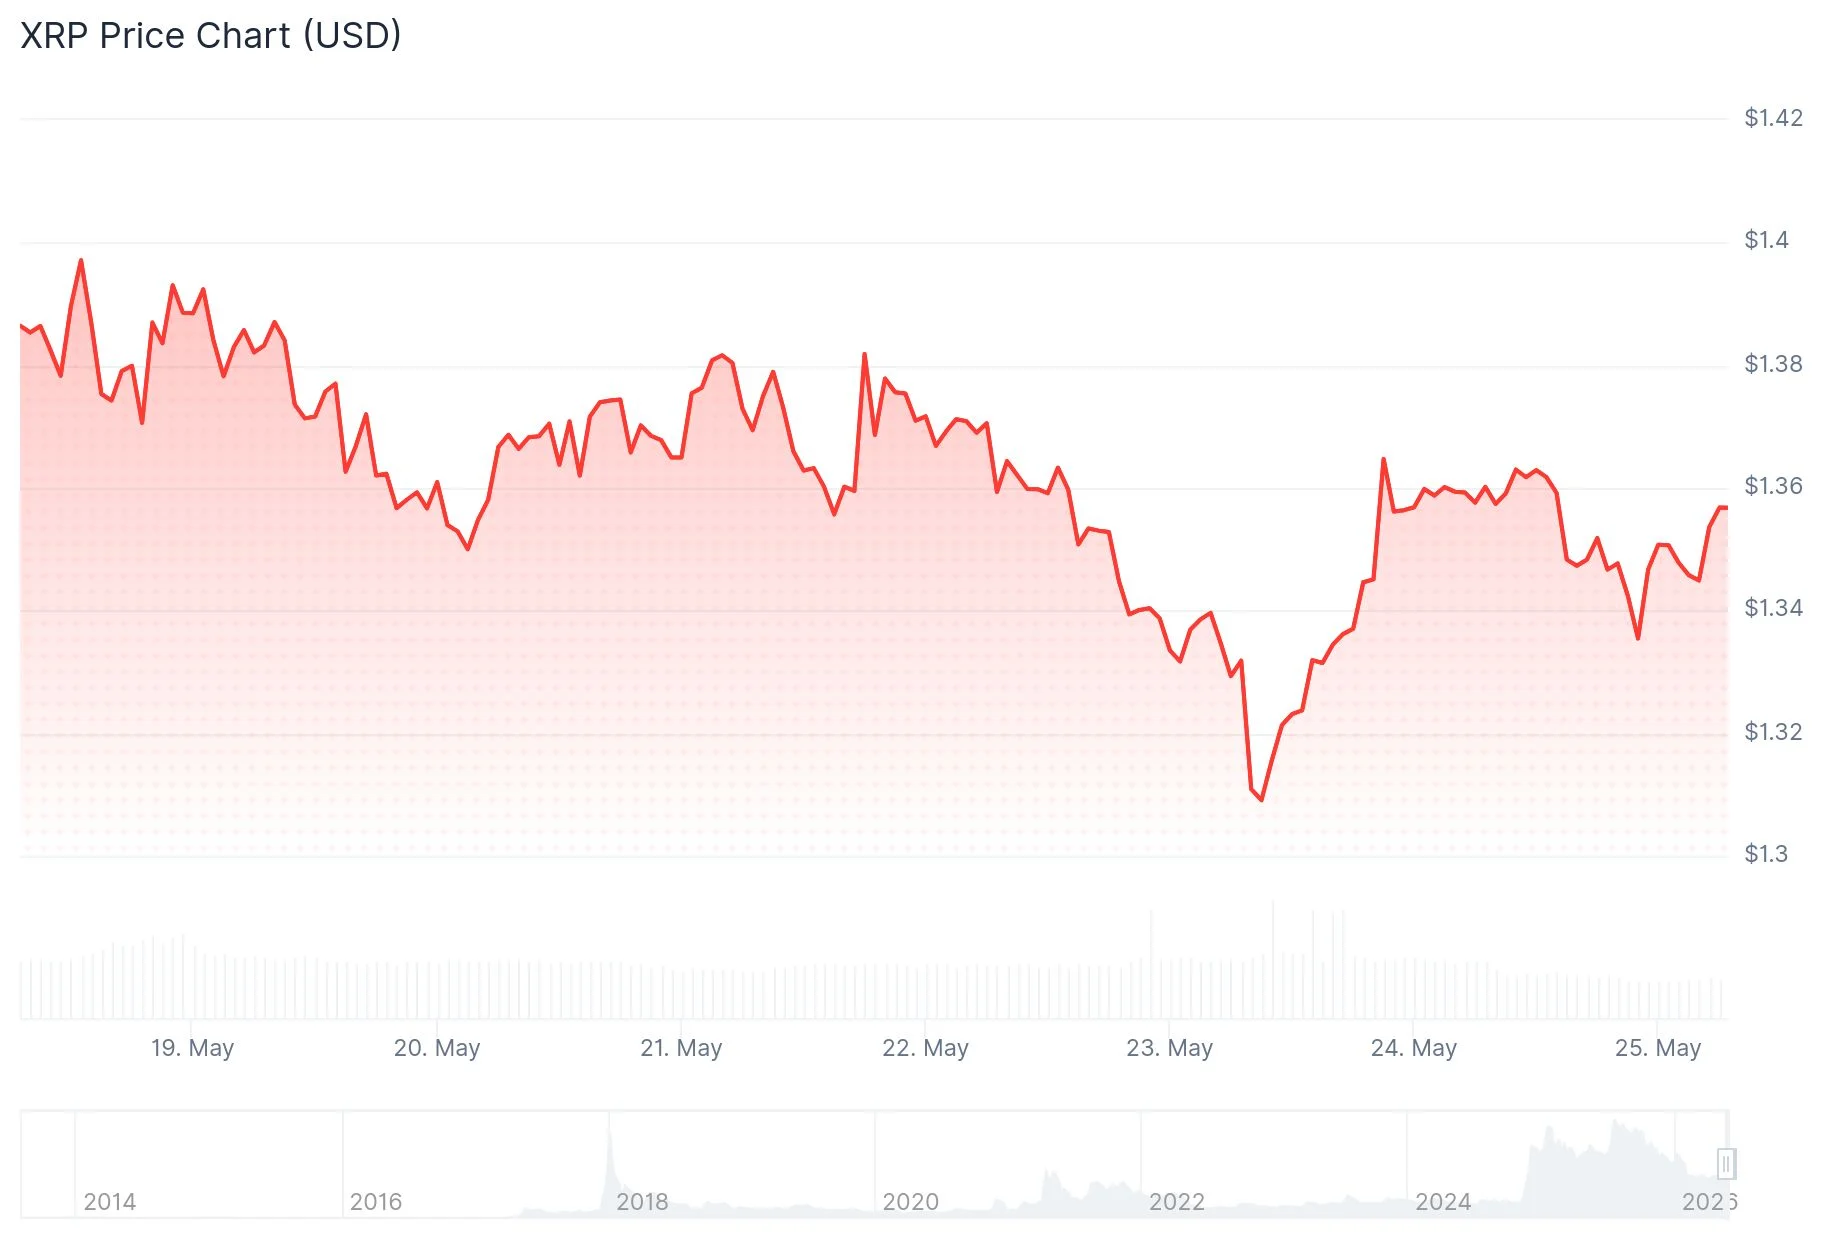
At the moment, XRP is changing hands around $1.36, reflecting a modest 3.49% uptick during the last 24-hour period. The digital asset has recorded approximately $1.94 billion in daily transaction volume, with its overall market valuation hovering near $84.18 billion.
ChartNerdTA, a cryptocurrency technical analyst, shared insights on X highlighting that $XRP has consistently touched its lower regression band on the bi-weekly chart during previous bearish cycles. The analyst emphasized that the lower regression band projection for 2026 currently rests at $1.00, while a definitive bearish trend reversal remains elusive — mirroring patterns observed in earlier market phases. The central question posed: what makes the current situation different?
EGRAG CRYPTO has maintained continuous observation of XRP’s technical formation since the beginning of April, asserting that the fundamental analysis remains intact. The analyst’s perspective suggests that day-to-day price fluctuations generate unnecessary distraction, whereas the underlying market structure provides genuine insight.
According to EGRAG, XRP remains confined within a descending broadening wedge formation. Such patterns frequently precede significant volatility episodes and can function as capitulation zones before substantial directional movements materialize.
Critical Price Zones Under Surveillance
EGRAG has pinpointed $1.11 as the paramount support threshold within the existing technical framework. Should price action penetrate below this level, it could catalyze a more pronounced corrective phase.

Regarding upside potential, the $2.65 to $3.00 corridor represents the decisive battleground. A confirmed weekly or monthly candle closure above $3.00 would fundamentally alter the prevailing market perspective, the analyst suggests.
The market commentary account BankXRP characterized the recent steep decline toward the $1.3080 level as a liquidity sweep operation. This movement seemingly flushed out weaker market participants amid escalating panic-driven liquidations.
Meanwhile, analyst CW indicated that additional downward pressure extending toward $1.30 remains within the realm of possibility should selling momentum persist.
Derivatives Market Signals
Open interest registered a marginal increase of 0.49%, reaching $2.85 billion, while trading volume contracted by 33.17% to $2.37 billion. This divergence between climbing open interest and declining volume suggests market participants are maintaining existing positions rather than initiating aggressive new trades.
The open interest-weighted funding rate currently stands at 0.0032%, indicating a balanced derivatives landscape. Present data reveals no pronounced directional bias favoring either bullish or bearish positioning.
EGRAG further sketched a potential roadmap for upcoming market behavior: extended consolidation, trader sentiment fatigue, a volatility explosion, followed by a decisive directional breakout.
Certain extended timeframe projections position XRP within a $7 to $11 range should the wedge pattern resolve to the upside, though such ambitious targets require substantially improved broader market dynamics.
XRP remains contained within the wedge configuration, with market participants closely monitoring whether the $1.11 support foundation can withstand ongoing selling pressure.
Get 3 Free Stock Ebooks
Discover top-performing stocks in AI, Crypto, and Technology with expert analysis.
- Top 10 AI Stocks - Leading AI companies
- Top 10 Crypto Stocks - Blockchain leaders
- Top 10 Tech Stocks - Tech giants


