
 Price Analysis: Recovery Rally Begins After $1.05 Flush as Bulls Target $1.30")
Quick Summary
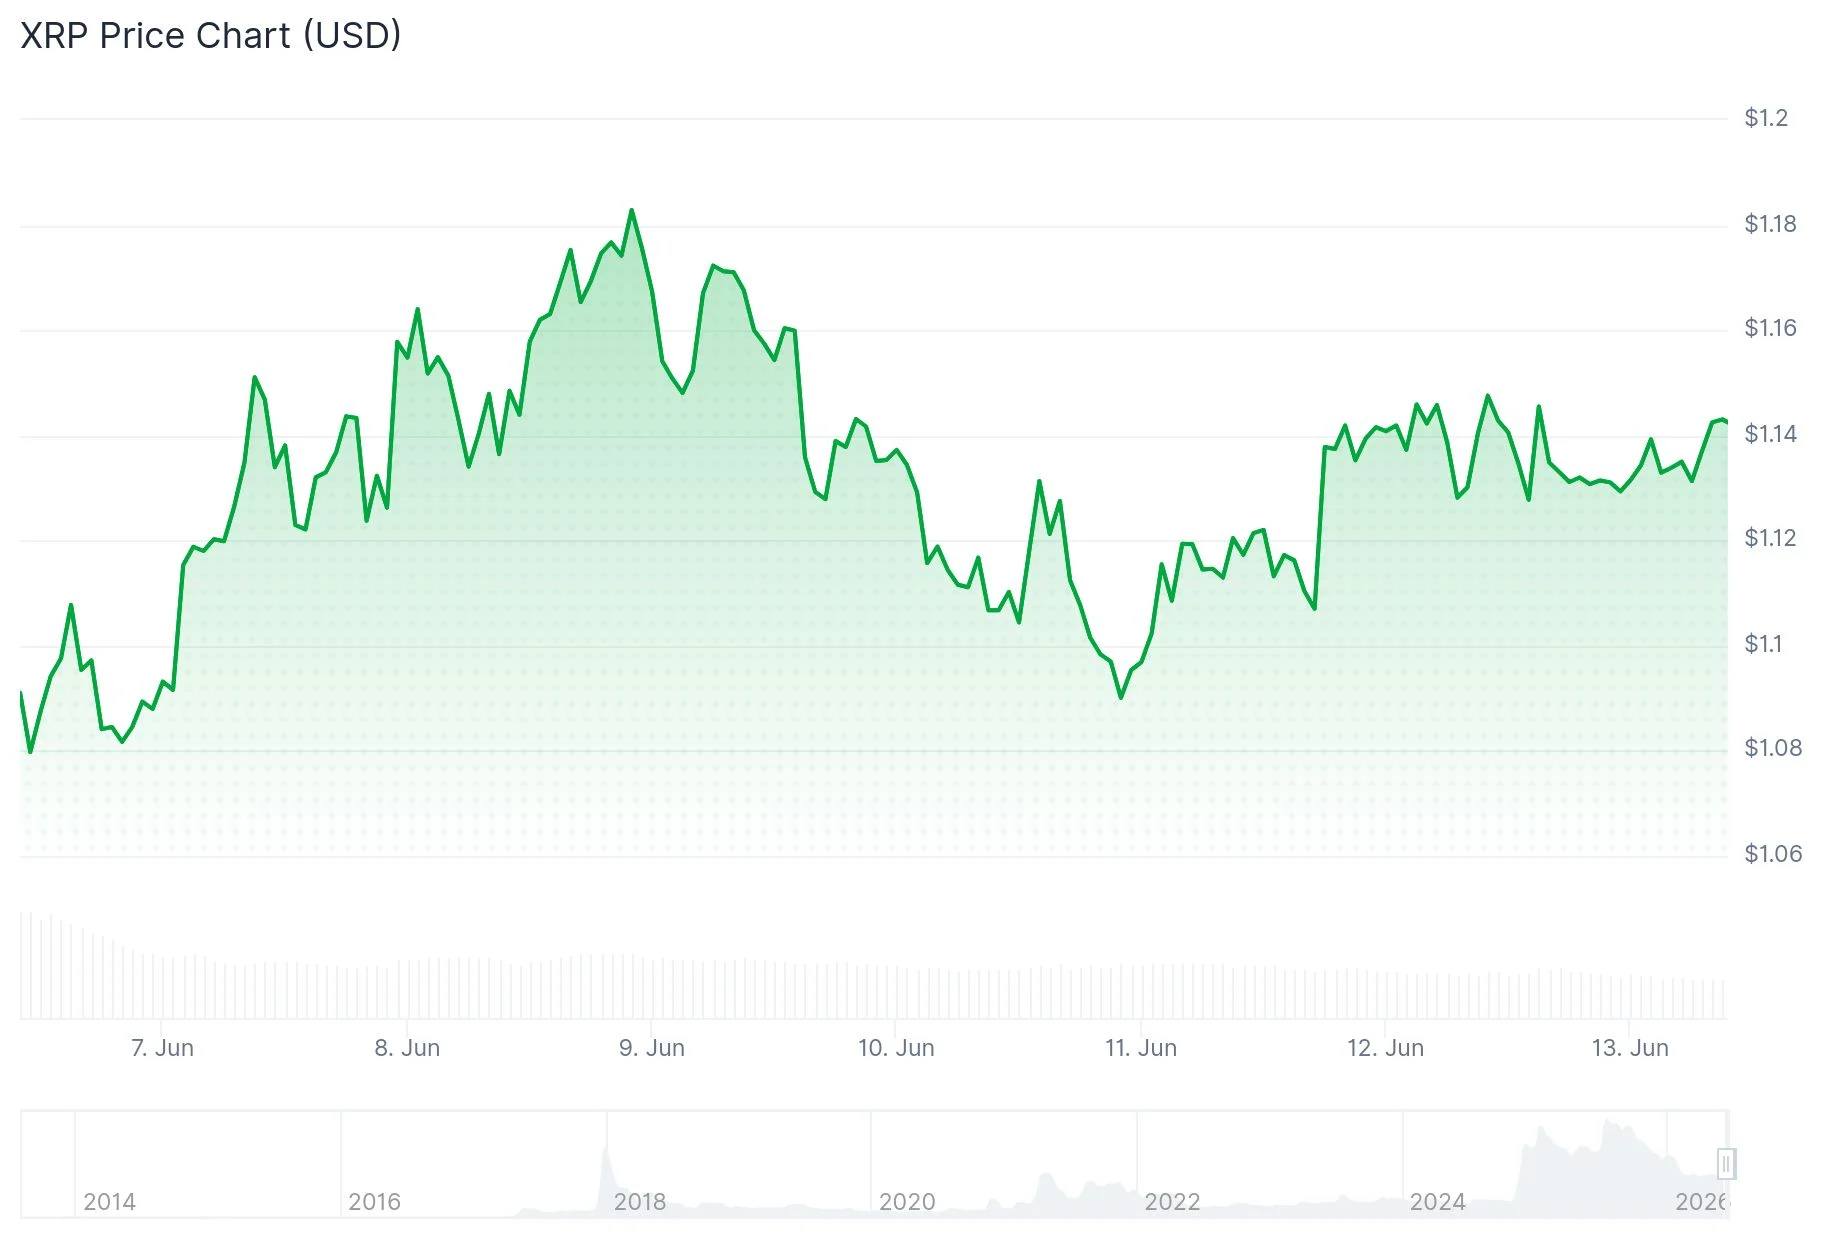
- XRP maintains support above $1.14 following a brief decline to $1.05 during the latest market downturn
- Technical analysts identify a bullish RSI divergence pattern, with $1.30 marked as the next significant resistance target
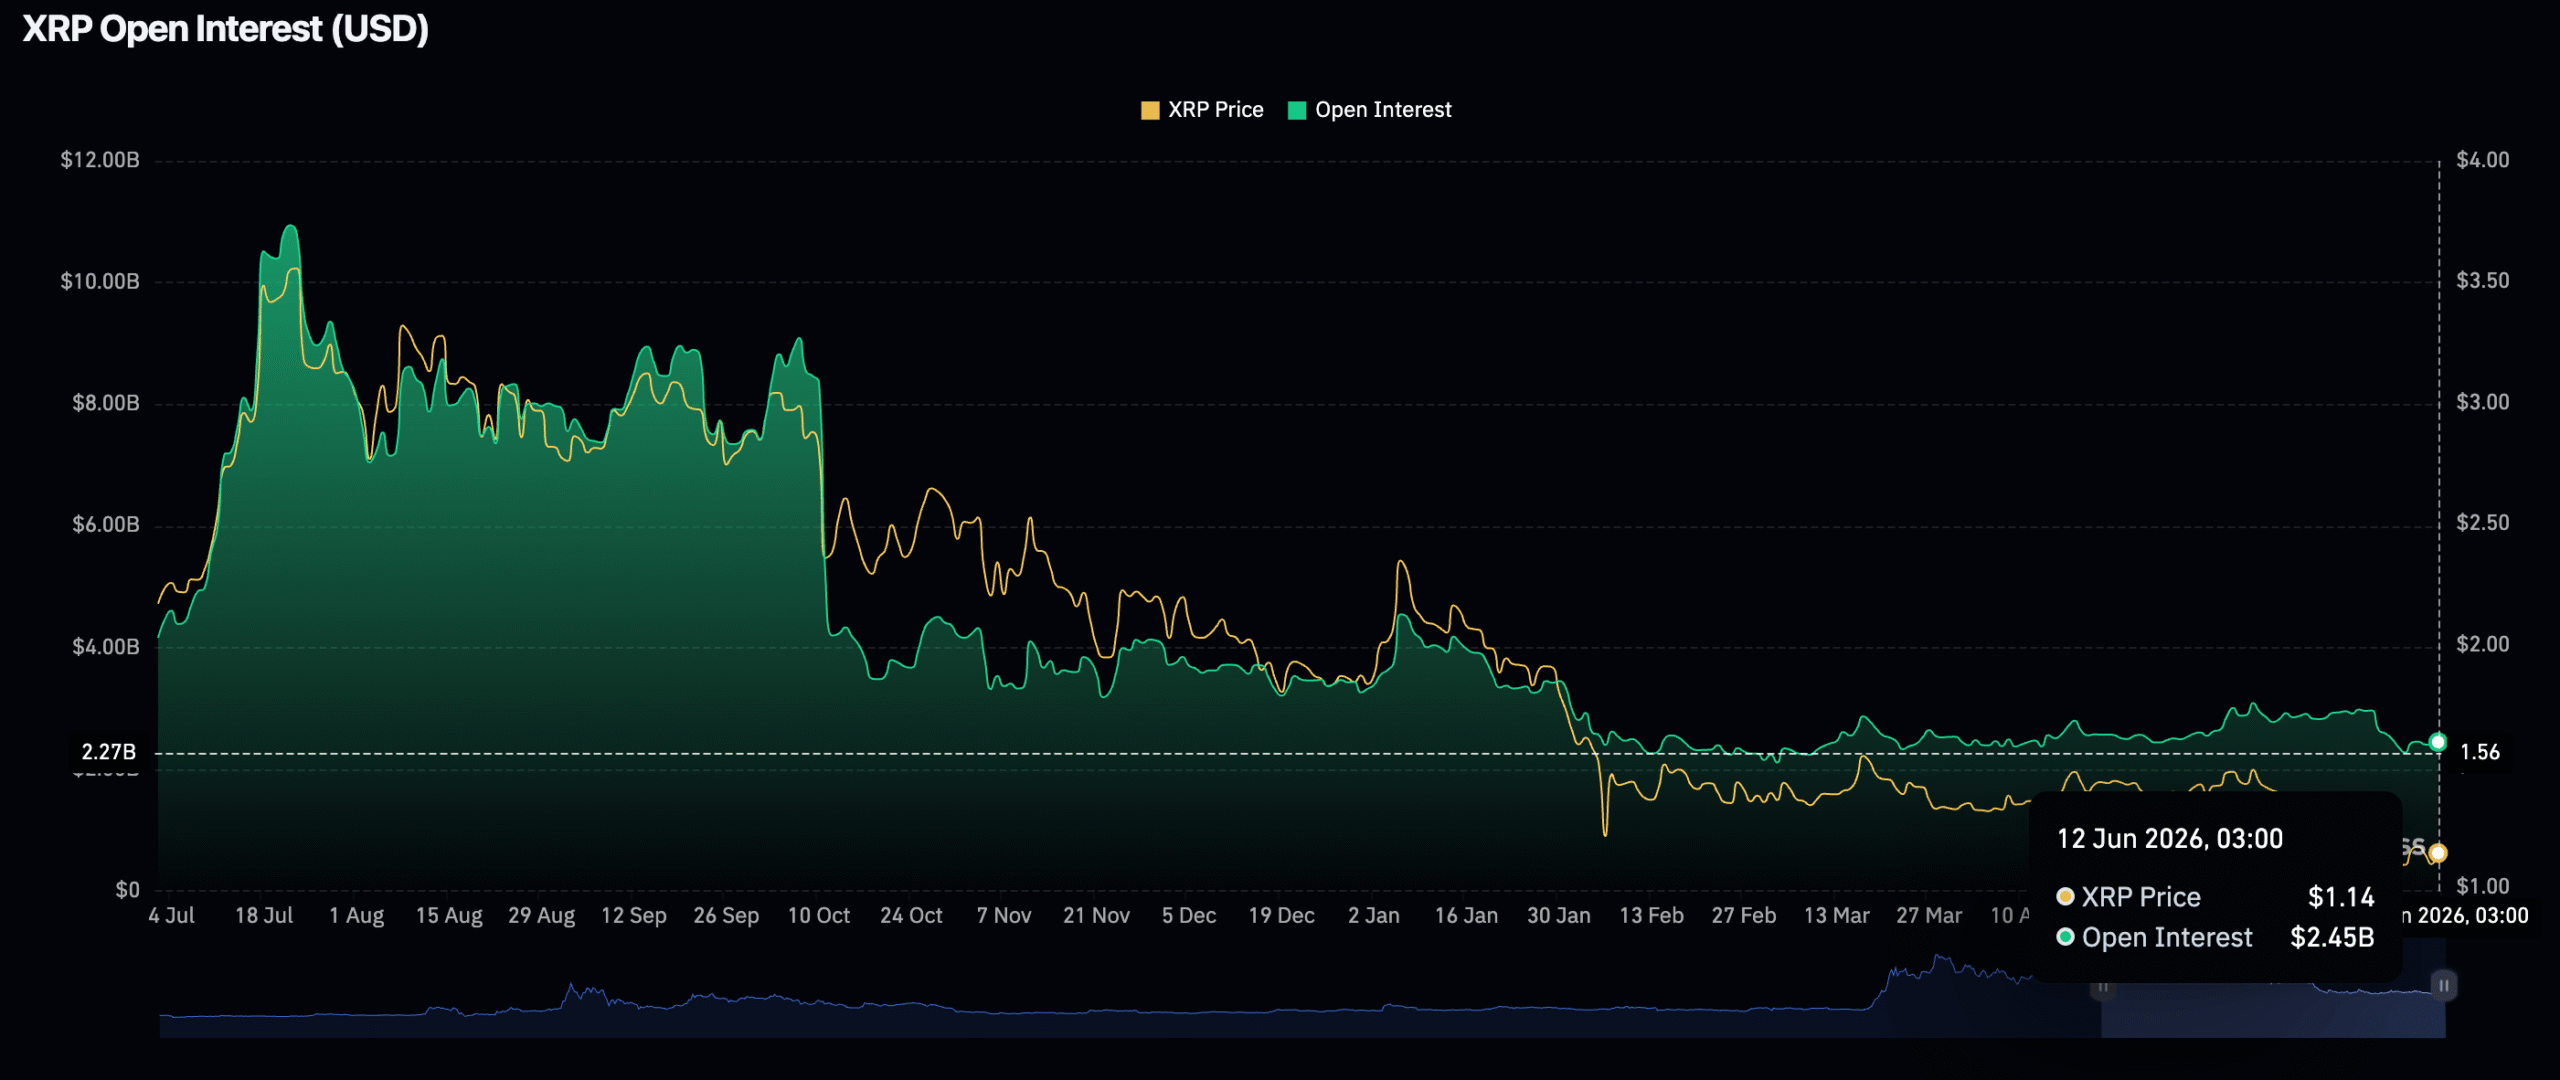
- Open Interest in futures contracts has declined to $2.45 billion from $2.96 billion recorded in early June
- XRP ETF activity shows inconsistent flows, with Thursday recording no inflows; total cumulative inflows reach $1.43 billion
- The token remains positioned beneath all primary moving averages, with the 50-day EMA around $1.30 serving as critical overhead resistance
XRP, the digital asset associated with Ripple Labs, is currently exchanging hands near $1.14 following a rebound from its June bottom at $1.05. The downward move liquidated stop-loss orders and eliminated over-leveraged positions before demand returned to the market.
CryptoPulse, a market technical analyst, characterized the price action as a “capitulation flush,” noting that the breach of the $1.13 support area represented a crucial cleansing event that typically precedes a meaningful reversal.
The subsequent bounce has highlighted an important technical formation developing on the Relative Strength Index indicator. Despite price establishing a lower low, the RSI registered a higher low — creating a bullish divergence that typically indicates diminishing bearish momentum.
Futures Activity and ETF Momentum Show Weakness
Open Interest across XRP futures markets averaged approximately $2.96 billion at the beginning of June but has contracted to $2.45 billion currently. This reduction signals that fewer market participants are establishing new leveraged positions, reflecting diminished optimism for an immediate price advance.
Activity in XRP spot exchange-traded funds has demonstrated inconsistency. Capital inflows reached $7.44 million on Tuesday and $1.2 million on Wednesday, yet Thursday registered zero activity. Total cumulative ETF inflows currently measure $1.43 billion, while net assets under management stand at $985 million.

ChartNerd, another technical analyst, highlighted a significant development on the two-week timeframe. Price action has retreated to the lower regression band of the Gaussian Channel at approximately $1.04, a technical area that has emerged at comparable junctures during previous market cycles. ChartNerd labeled this zone as “the land of macro opportunity” and emphasized that this pattern has demonstrated reliability across multiple cycles.
Key Moving Averages Present Overhead Challenges
XRP continues to trade beneath its 10-day, 50-day, 100-day, and 200-day exponential moving averages. The 50-day EMA is positioned near $1.30, coinciding precisely with the major resistance zone identified by market technicians.
The 100-day EMA rests around $1.39, with the 200-day EMA located approximately at $1.61. These technical levels constitute a substantial overhead supply zone that must be overcome to establish a durable uptrend.
The 14-period RSI currently registers at 35.10, approaching but not yet reaching oversold conditions. The MACD histogram shows a marginally negative reading of -0.06656. The 10-period Momentum oscillator has transitioned to a Buy signal, potentially suggesting that immediate downside pressure is moderating.
According to TradingView’s aggregated technical assessment, the overall rating stands at Neutral, comprising 14 Sell indicators, 10 Neutral readings, and only 2 Buy signals.
An Elliott Wave technical framework indicates XRP may be finalizing a Wave (2) corrective phase within a broader Cycle Wave V pattern. The projected accumulation range spans between the 50% and 61.8% Fibonacci retracement levels, approximately $1.19 to $0.91. Technical strategists assign a 65-70% probability that the larger bullish market structure remains valid.
At the time of publication, XRP was changing hands around $1.14, representing a 3.06% gain over the preceding 24-hour period.
Get 3 Free Stock Ebooks
Discover top-performing stocks in AI, Crypto, and Technology with expert analysis.
- Top 10 AI Stocks - Leading AI companies
- Top 10 Crypto Stocks - Blockchain leaders
- Top 10 Tech Stocks - Tech giants

