
 Plunges Below $60K: Are We at a Cycle Bottom?")
Key Highlights
- BTC plunged beneath the $60,000 threshold, recording its weakest monthly showing since mid-2022.
- The leading cryptocurrency has declined 33% year to date, contrasting sharply with the S&P 500’s 9%+ gain.
- Bitcoin ETFs experienced their eighth consecutive week of net outflows, with June withdrawals exceeding $4 billion.
- MicroStrategy (MSTR) secured $1 billion in funding for cash reserves rather than additional BTC purchases.
- Market observers Ali Charts and Barchart identify historical patterns that may indicate a cycle low.
Bitcoin slipped beneath the $60,000 mark this Tuesday, registering its poorest monthly showing in three years.
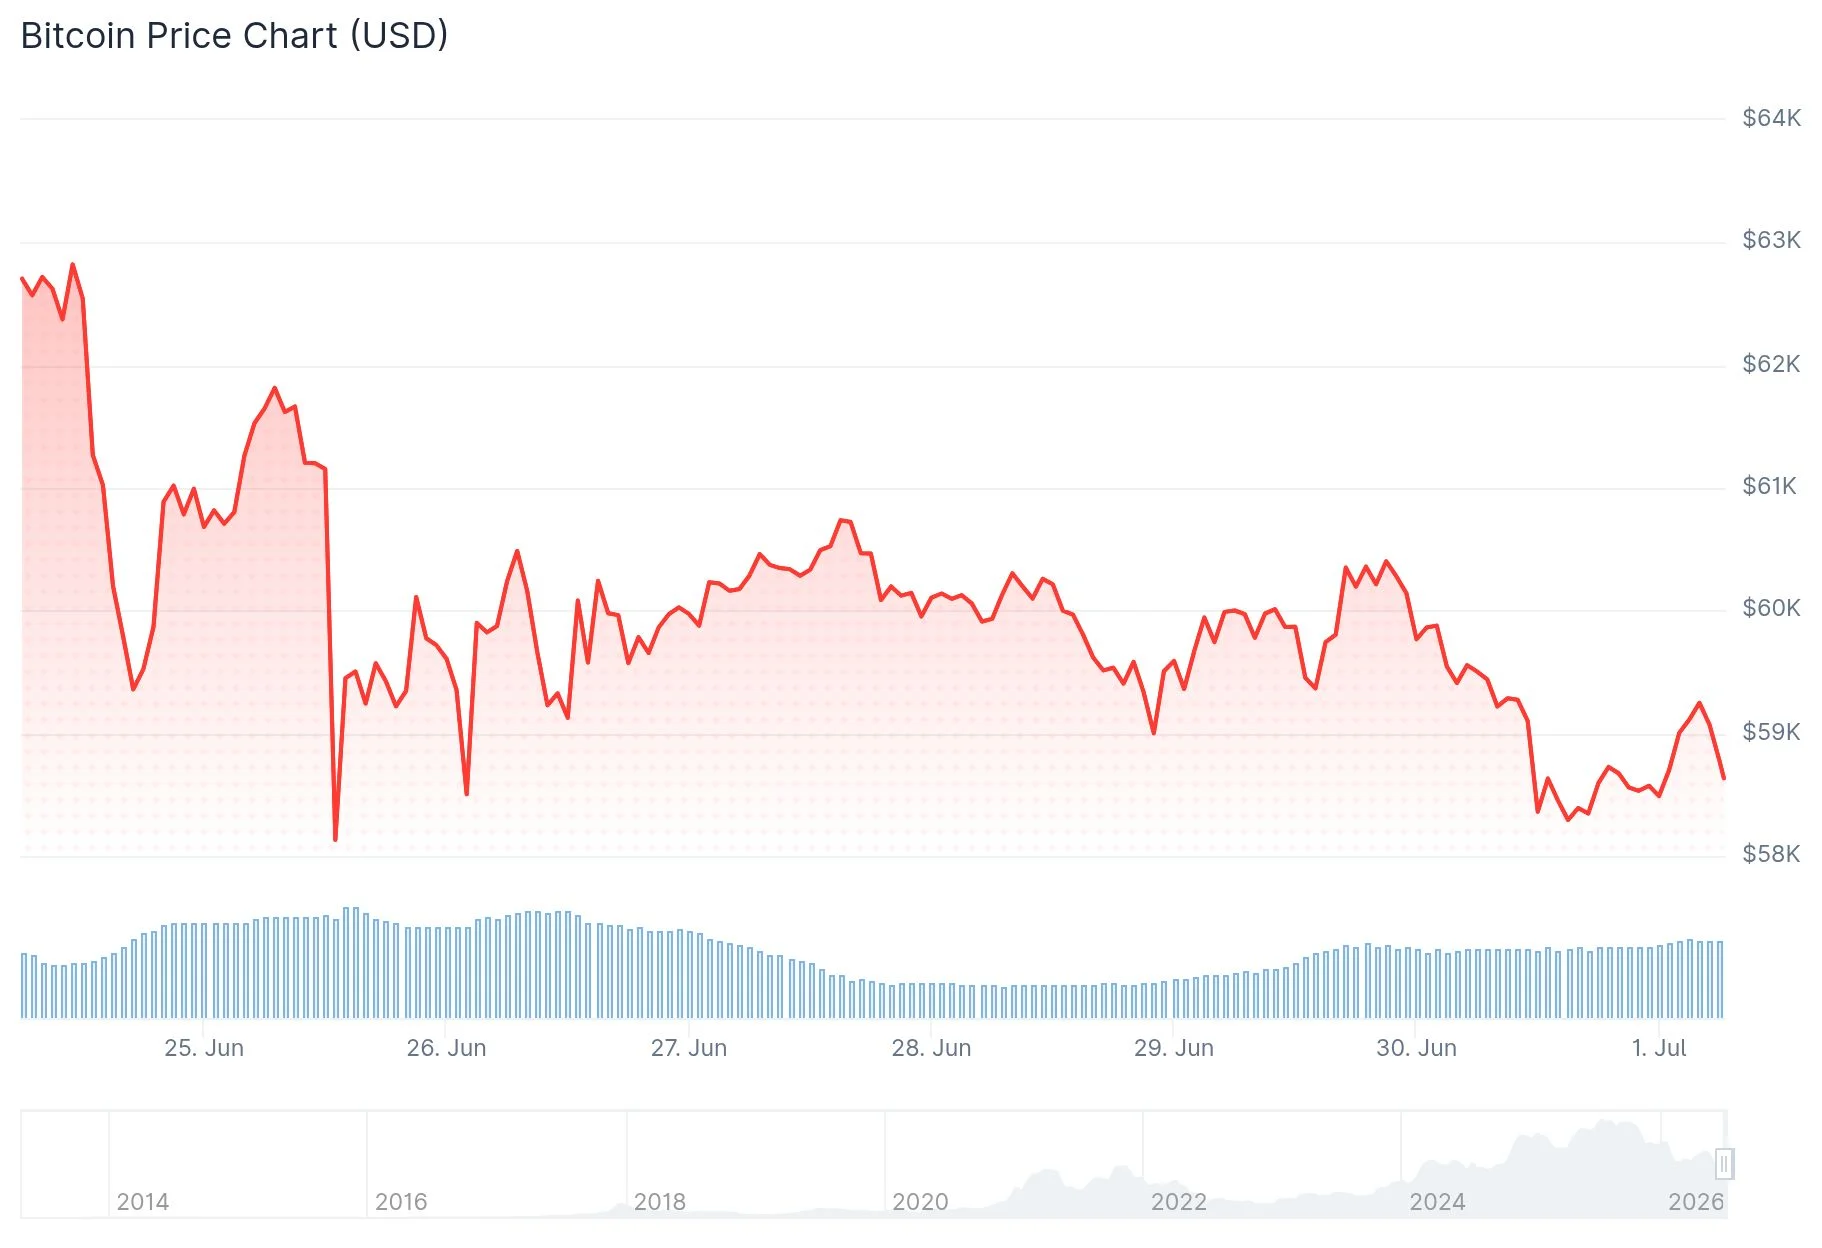
The digital asset hovered around $58,628, shedding 2.9% during the trading session. This performance put it on course for consecutive quarterly declines for the first time since 2022.
Year-to-date figures show Bitcoin retreating 33%, while the S&P 500 has advanced beyond 9% during the identical timeframe.
From its October all-time peak, the token has surrendered approximately 52% of its value. Persistent selling activity and forced position closures have accelerated the downturn.
Expectations of interest rate increases have intensified the pressure. The Federal Reserve adopted a more hawkish stance during its June policy meeting, elevating the probability of another rate adjustment before year-end.

Elevated interest rates diminish the appeal of non-income-generating assets like bitcoin. Market participants have also adopted a more defensive posture amid escalating U.S.-Iran geopolitical tensions.
Bitcoin ETF Withdrawals Persist
Spot bitcoin exchange-traded funds recorded outflows for their eighth week running. Monday’s session alone witnessed $231.1 million in redemptions, per SoSoValue data.
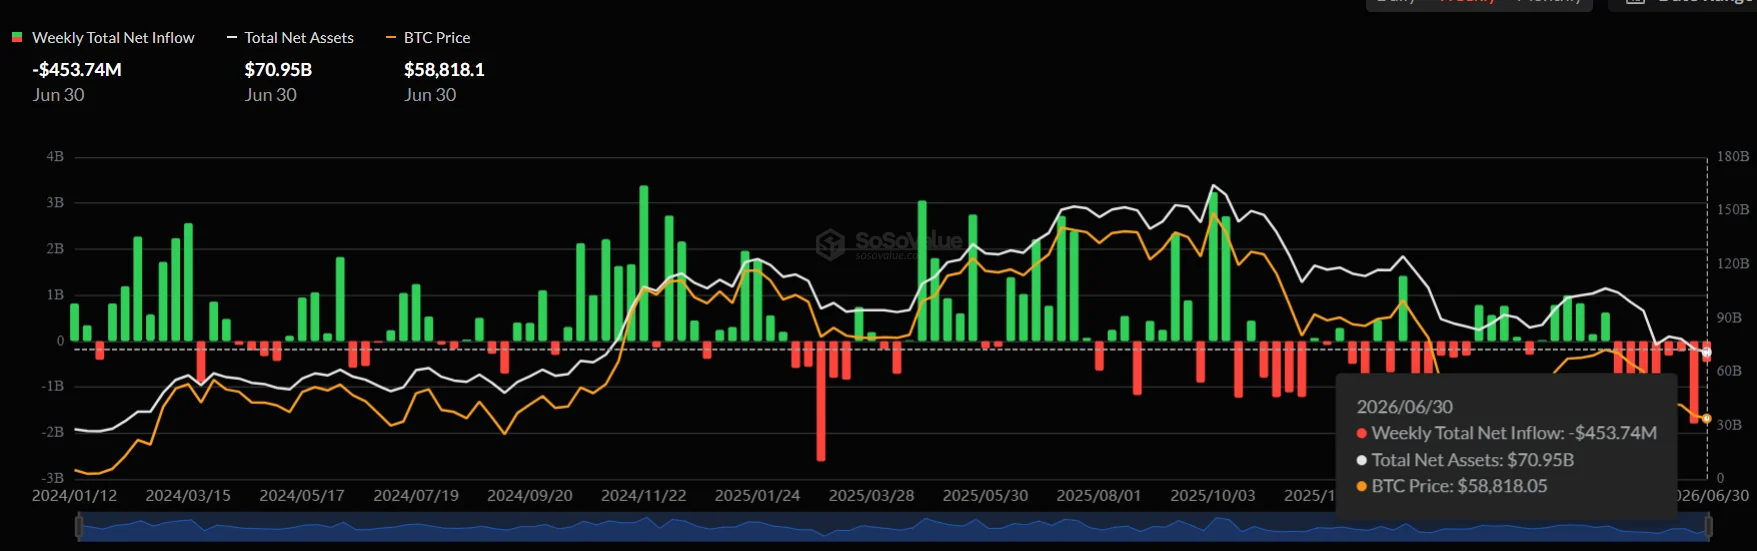
June’s aggregate outflows surpassed $4 billion across all 13 U.S.-traded products. This represents the steepest monthly withdrawal figure since these funds debuted in January 2024.
Cumulative ETF outflows from late April onward have approached $6.7 billion. Legislative uncertainty surrounding the stalled CLARITY Act has compounded investor hesitation.
MicroStrategy, holding the largest corporate bitcoin position, secured over $1 billion in capital on Monday. The company announced these proceeds would strengthen cash positions instead of expanding bitcoin holdings.
Compass Point’s Ed Engel characterized the decision as alleviating balance sheet concerns. “Crypto market cycles have historically concluded with catastrophic failures, and MSTR was emerging as the preferred short candidate among pessimists,” he noted.
Engel observed this downturn differs from previous cycles. “This market phase hasn’t witnessed significant insolvencies stemming from excessive leverage or fraudulent activity,” he stated.
Market Observers Highlight Historical Trends
On social platforms, market watcher Ali Charts identified an unusual blockchain metric. The analysis revealed that 10.45 million bitcoin units currently sit underwater, surpassing the 9.60 million held profitably.
Ali Charts emphasized this crossover has occurred exclusively at significant cycle troughs—specifically in 2011, 2014, 2018, and 2020. Each previous occurrence preceded a substantial bull market rally.
Meanwhile, Barchart’s analysis highlighted that bitcoin settled beneath its 200-week moving average for the first occasion since 2023. The commentary characterized this technical level as historically representing an attractive entry point.
However, not all market strategists anticipate an imminent bottom. Finality Capital Partners’ David Grider projects the trough won’t materialize until autumn.
“A decline to $40,000 or $45,000 wouldn’t be outside the realm of possibility,” Grider informed Yahoo Finance on Tuesday.
Get 3 Free Stock Ebooks
Discover top-performing stocks in AI, Crypto, and Technology with expert analysis.
- Top 10 AI Stocks - Leading AI companies
- Top 10 Crypto Stocks - Blockchain leaders
- Top 10 Tech Stocks - Tech giants

