



Key Takeaways
- BTC surged past the $63,000 mark with approximately 1.5% gains following diplomatic statements from Trump regarding Iran
- Market participants are closely monitoring $64,700 as a critical threshold for the daily candle close that could trigger an extended relief rally
- Nearly $100 million in cryptocurrency short positions were liquidated over a 24-hour period
- Blockchain analytics reveal short-term holder losses reaching levels historically associated with cycle bottoms
- Large wallet holders have accumulated 10,000 BTC throughout the current month, suggesting a potential accumulation period
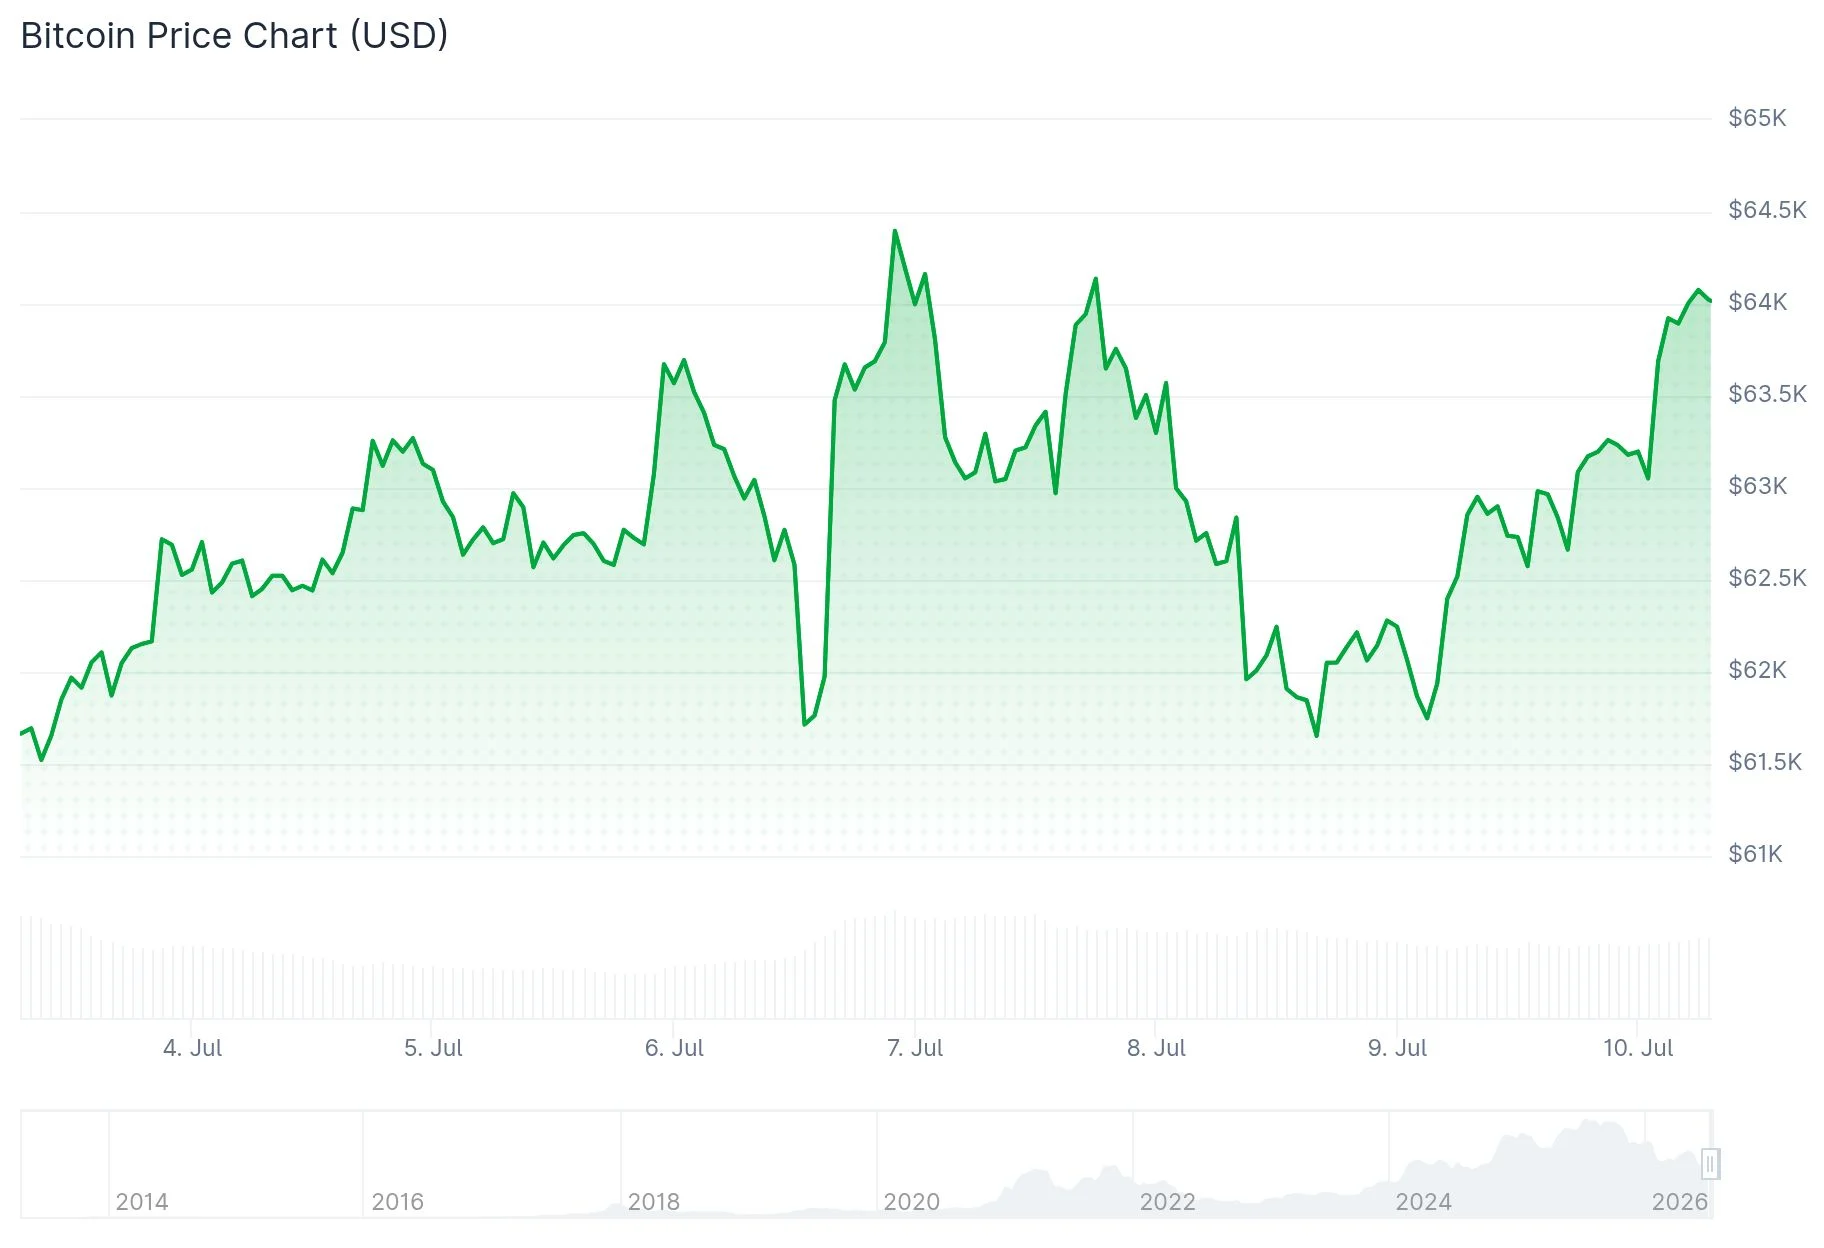
Bitcoin surged back above the $63,000 threshold on Thursday following remarks from US President Donald Trump indicating Iran is seeking diplomatic negotiations. The leading cryptocurrency posted gains of approximately 1.5% during the trading session.
Traditional equity markets also experienced upward momentum, providing support to digital asset markets following Wednesday’s downturn. Trump’s previous announcement that the Iran ceasefire had concluded had triggered anxiety across risk-sensitive assets.
Data from CoinGlass indicates cryptocurrency short position liquidations approached $100 million within a 24-hour window. This development caught numerous market participants who had wagered on declining prices off guard.
Analyst Daan Crypto Trades highlighted $64,700 as the critical threshold to monitor at the daily candle close. “A daily close above $64,700 flips the story and would make for a larger relief rally across the board,” he posted on X.
He cautioned that a close beneath $61,300 “opens the road to the lows again and kills the momentum.” Bitcoin has been oscillating within this price corridor.

Trader Killa expressed they are “not bearish at all” regarding the present market structure. They’re targeting $68,000 as a potential area for short positions and anticipate several more months of volatile sideways movement.
Trader Jelle identified $65,000–$70,000 as the subsequent objective if bullish forces recapture critical thresholds. He noted that rejection at these levels could drive BTC back beneath $60,000.
Market analyst Ted (@TedPillows) noted unexpected BTC purchasing activity on Binance and suggested if Bitcoin reclaims $65,000, an upward correction toward $72,000–$74,000 might materialize within a three to four-week timeframe.
Blockchain Metrics Indicate Potential Cycle Bottom Formation
Glassnode analytics demonstrate that short-term holder (STH) realized losses have escalated to levels witnessed only six times throughout Bitcoin’s trading history. During all six previous occurrences, BTC was positioned near or at a cycle bottom.
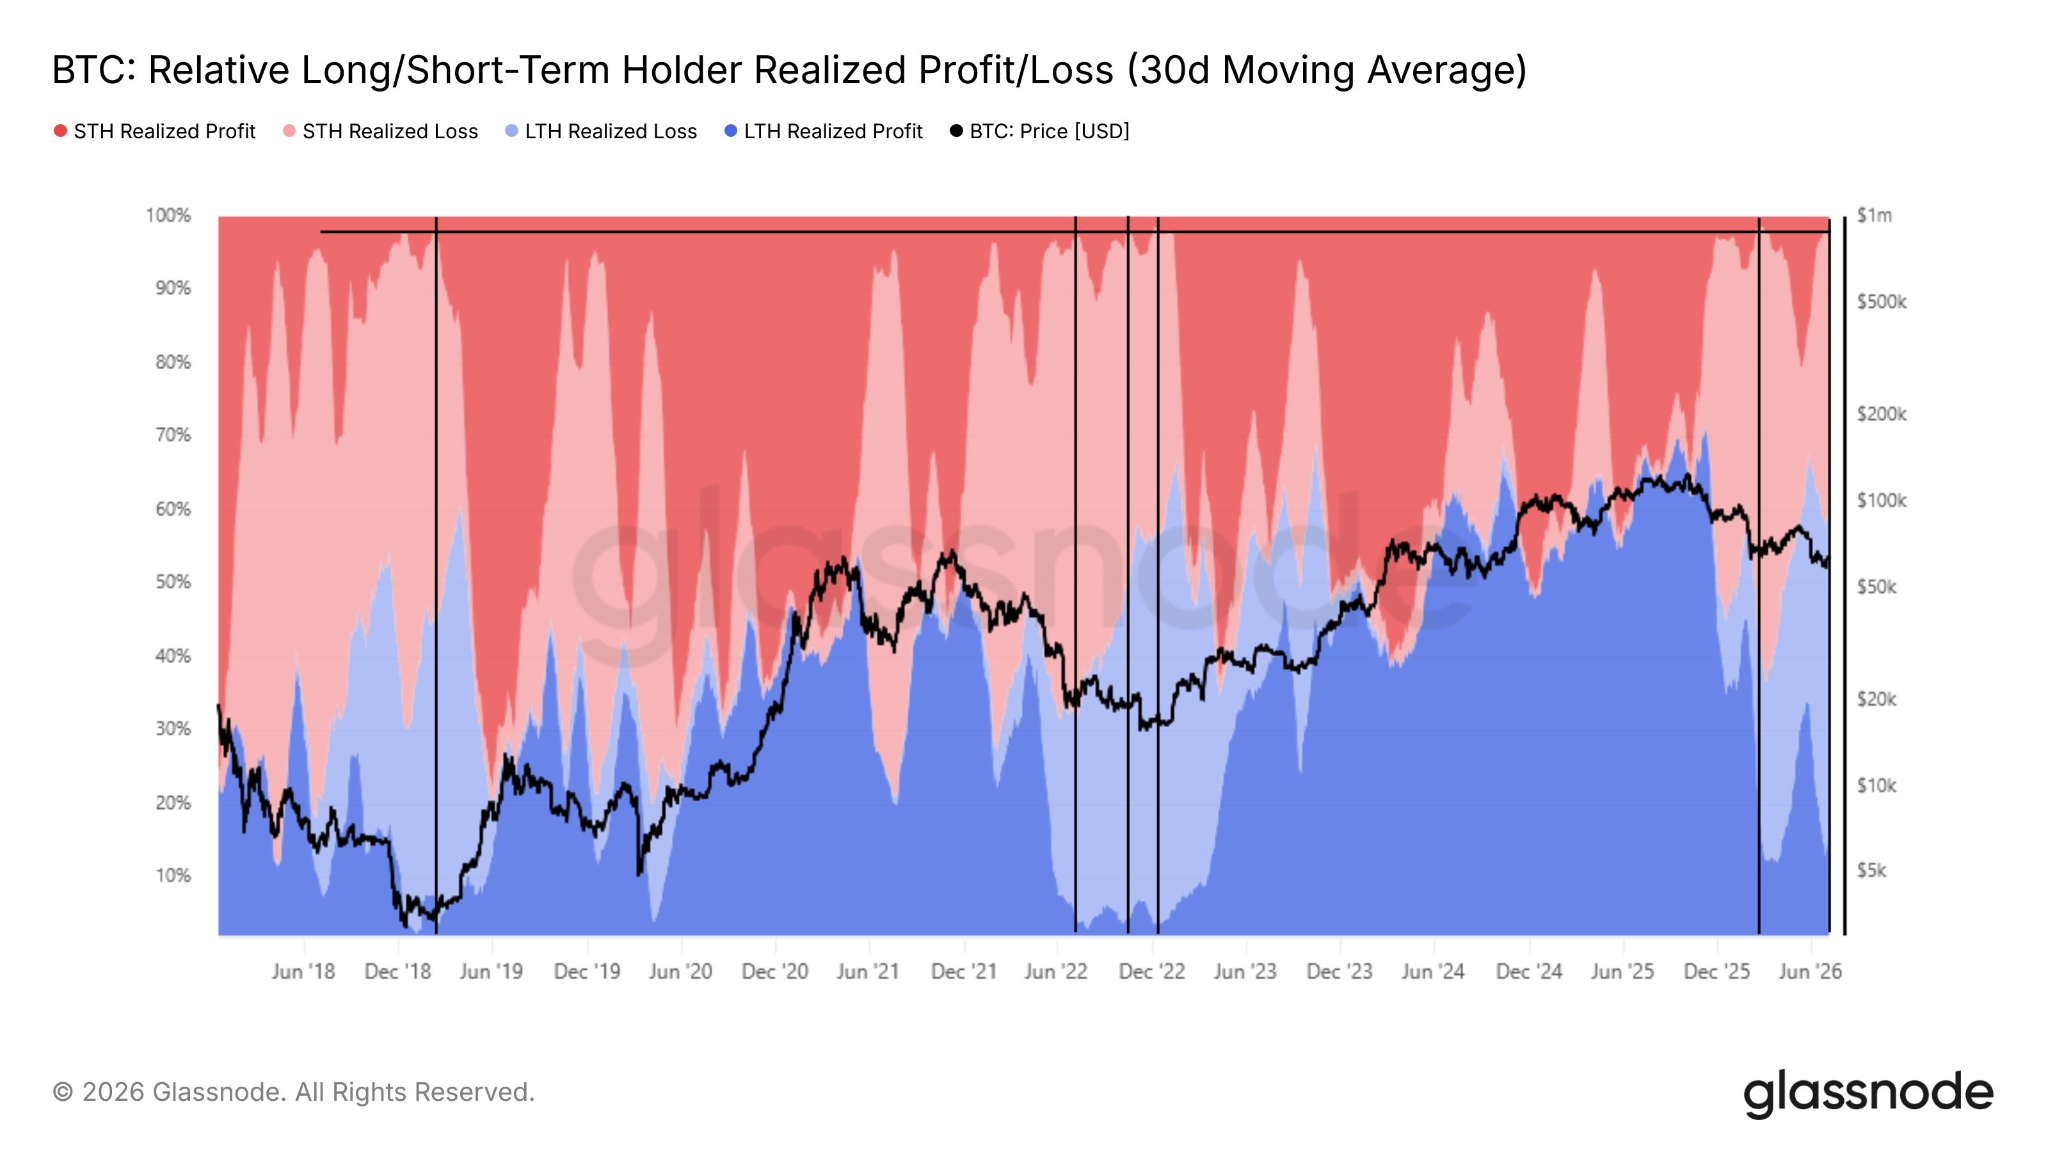
The most recent instance occurred in January of this year, when Bitcoin reached $60,000 before mounting a rally to $82,000.
Large wallet addresses have added 10,000 BTC during the present month. The two preceding months also recorded positive inflows, which market observers interpret as evidence of a probable accumulation phase.
BTC Must Breach $66,000 to Validate Chart Formation
A double-bottom W-shaped structure has emerged on the daily timeframe. This technical formation frequently precedes significant upward price movements.
Bitcoin requires a close above $66,000 to validate this pattern. The Relative Strength Index remains positioned below 50, indicating no bullish confirmation has materialized yet.
Market analysts suggest a decline to $60,000 remains possible before any substantial upward movement. Should BTC fall below that threshold, $50,000 is referenced as the subsequent major support zone.
If Bitcoin maintains support above $60,000, a retest of the 200-day Exponential Moving Average near $74,000 represents the scenario market observers are projecting.
Current price action shows BTC trading within the $61,300 to $64,700 range, with market participants closely watching the daily close for directional cues.
Get 3 Free Stock Ebooks
Discover top-performing stocks in AI, Crypto, and Technology with expert analysis.
- Top 10 AI Stocks - Leading AI companies
- Top 10 Crypto Stocks - Blockchain leaders
- Top 10 Tech Stocks - Tech giants


